Infographics Worksheets
All About These 15 Worksheets
Understanding and creating infographics is a valuable skill in today’s information-driven world. This series of 15 worksheets on Infographics is designed to introduce students to the concept of infographics, develop their visual literacy, and empower them to create compelling and informative visual representations of data. Each worksheet within this series focuses on different aspects of infographics, providing students with opportunities to explore various design elements, analyze existing infographics, and create their own visually engaging and informative graphics. Through these worksheets, students will:
- Learn about the power of visual communication and the role of infographics in presenting complex information in a clear and engaging manner;
- Analyze the data on existing infographics and deconstruct its form;
- Practice transforming raw data into visually appealing and informative representations;
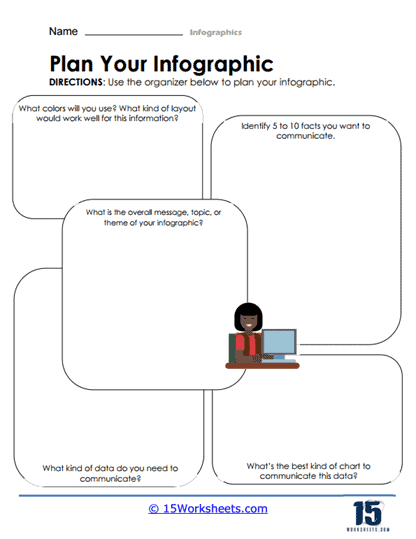
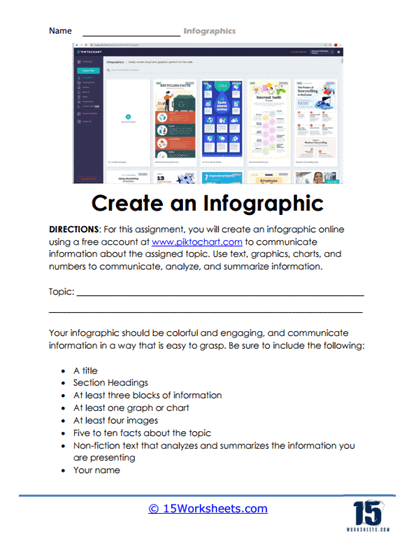
- And select a topic, gather relevant data, and design an infographic that effectively communicates the information in a visually engaging and informative way.
This series of Infographics worksheets equips students with the skills necessary to understand, analyze, and create compelling visual representations of data. By engaging with these activities, they will develop their visual literacy, critical thinking, and design skills. They will also learn to effectively communicate complex information through visual means, fostering an understanding of data visualization and enhancing their ability to navigate and create impactful infographics. Overall, this series empowers students to become effective visual communicators in an increasingly data-driven world.
What Are Infographics?
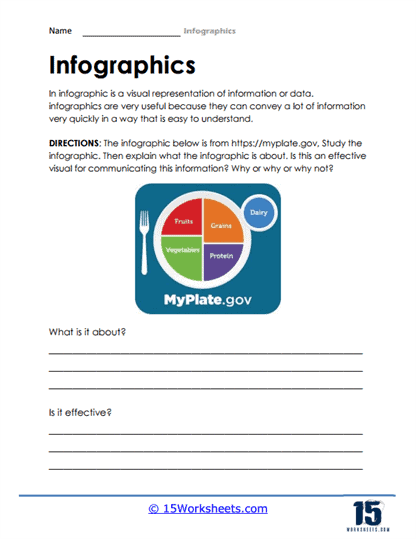
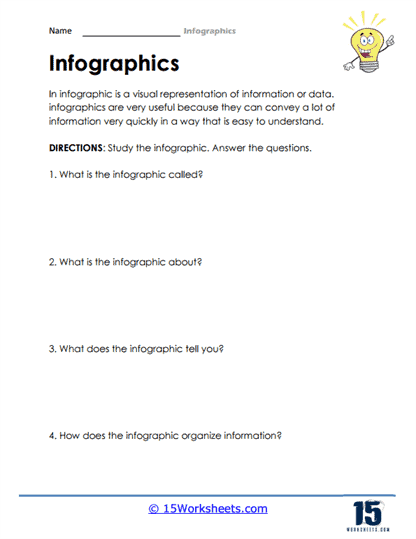
An infographic is a visual representation of data or information. They can be used to display statistics, convey a message, or simply help illustrate a point. Infographics are often shared on social media and other online platforms, as they are an engaging way to communicate complex information in a visually appealing format. There are many different types of infographics, each with its own unique style and purpose.
The History of Infographics
Infographics have been around for centuries. The earliest known example of infographics dates back to the 18th century when agriculturalist Jethro Tull invented a “seed drill” that helped farmers plant seeds in evenly spaced rows. Tull’s invention was so successful that it was soon being used all over Europe.
In the 19th century, another important milestone in the history of infographics occurred with the development of the steam engine. British engineer George Stephenson created a series of diagrams to explain how his new invention worked, and these diagrams helped to popularize the use of infographics as a way to communicate complex ideas.
Today, infographics are used in everything from news stories to marketing campaigns, and they show no signs of slowing down. With the ever-growing amount of data available, infographics will continue to be an essential tool for making sense of the world around us.
The Benefits of Using Infographics
In a world where we are constantly bombarded with information, it can be hard to know what to pay attention to and what to ignore. Moreover, many people have developed short attention spans and are easily distracted. This is where infographics can be useful. By using images, colors, and numbers, infographics can communicate complex ideas quickly and effectively. When used properly, they can help people to focus and retain information.
Additionally, by breaking down information into manageable chunks, infographics can make dry or difficult topics more palatable. For these reasons, infographics can be extremely useful tools for both individuals and businesses.
As the saying goes, “A picture is worth a thousand words.” And when it comes to conveying information quickly and effectively, there’s no doubt that infographics have a lot to offer. By condensing complex data into a visually appealing format, infographics can help readers understand complex concepts more quickly and retain information more effectively.
In an increasingly fast-paced world, infographics offer a welcome respite from the barrage of text-based information we’re constantly bombarded with. As the popularity of infographics continues to grow, there’s no doubt that they will become an increasingly important tool for communicators across a wide range of industries.
Types of Infographics
Infographics come in all shapes and sizes, but there are three types that are most common. The first type is the visual list, which, as the name suggests, uses visuals to list out information. This could be a timeline of events or a list of the world’s tallest mountains.
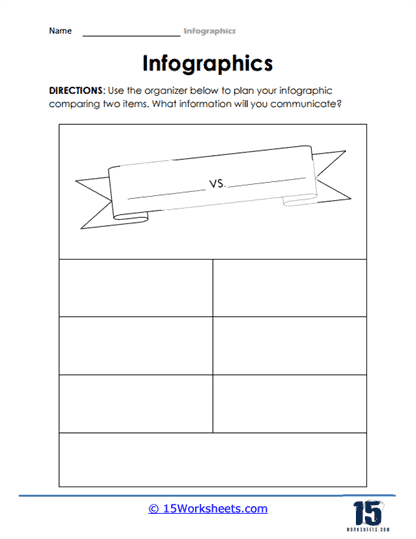
The second type is the compare and contrast infographic, which is used to show the similarities and differences between two things. This could be two different products or two different historical figures.
The last type is the process infographic, which is used to show how something works. This could be anything from how a car engine works to how to make a perfect cup of coffee. No matter what type of infographic you’re looking for, there’s sure to be one out there that will fit your needs.