H-R Diagram Worksheets
All About These 15 Worksheets
The H-R diagram (short for Hertzsprung-Russell diagram) may look like just another scatterplot, but it’s actually one of astronomy’s coolest tools. It helps scientists figure out what stars are doing with their lives-whether they’re just hanging out on the main sequence, getting old and puffy as red giants, or quietly glowing as white dwarfs. These worksheets break down the diagram so students don’t just see a jumble of dots, but actually understand how temperature and brightness connect. With a mix of plotting, labeling, vocabulary, and problem-solving, learners get both the science skills and the “aha!” moments that make space feel a little more personal.
The beauty of this collection is that it blends math, science, and visual learning in one place. Some worksheets are hands-on, asking kids to plot stars directly, while others are more reflective, encouraging them to read diagrams, analyze patterns, or write about what they see. That variety keeps lessons engaging-whether students are number-crunchers, word lovers, or visual learners. The repetition across activities makes it nearly impossible to walk away without having a solid grasp of what an H-R diagram is showing.
And here’s the extra sparkle: these worksheets don’t just teach diagram skills, they tie students directly into the big questions of the universe. When a student realizes our Sun has a special spot on the H-R diagram, or that Sirius and Betelgeuse sit in totally different regions, suddenly astronomy feels alive. They’re not just graphing data; they’re literally charting the life stories of stars. That sense of connection to the cosmos is what makes these worksheets shine brightest.
Have a Look Inside Each Worksheet
Making Points
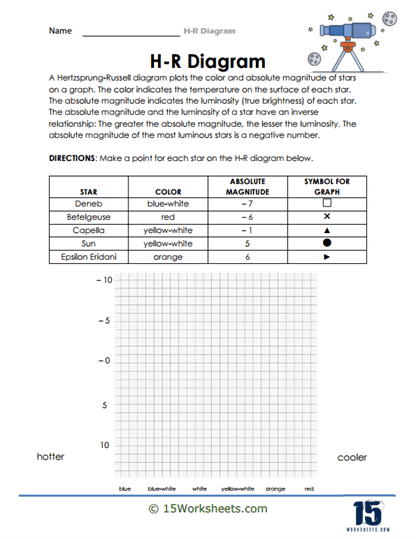
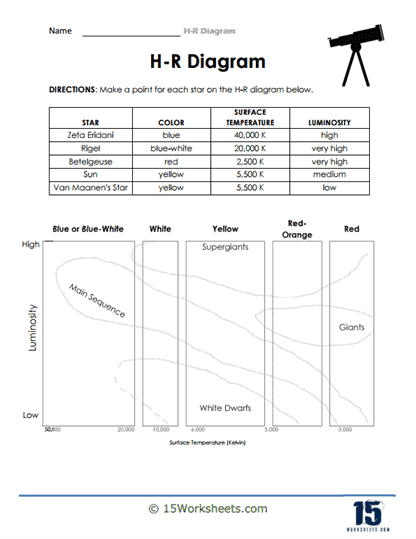
Students plot points on an H-R diagram-translating data on star color and brightness into visual spots. It strengthens their mapping skills and reinforces how data translates into scientific graphs. The activity is hands-on and helps them observe patterns in temperature and luminosity. It’s a gentle introduction to reading star charts.
Paragraph Completion
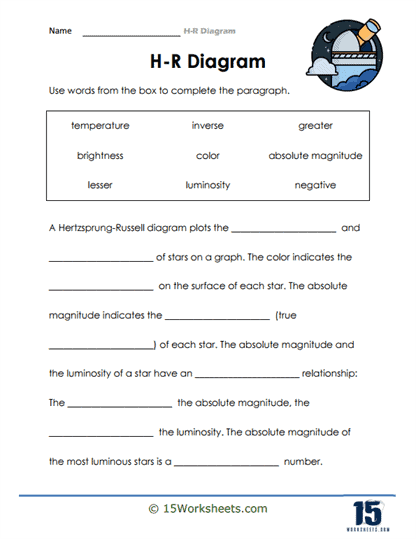
Learners complete sentences or short paragraphs using key astronomy terms. It boosts reading comprehension while solidifying vocabulary like “main sequence,” “luminosity,” and “white dwarf.” The activity blends language with science in a smooth, engaging way. A clever way to merge writing and space learning.
H-R Vocabulary
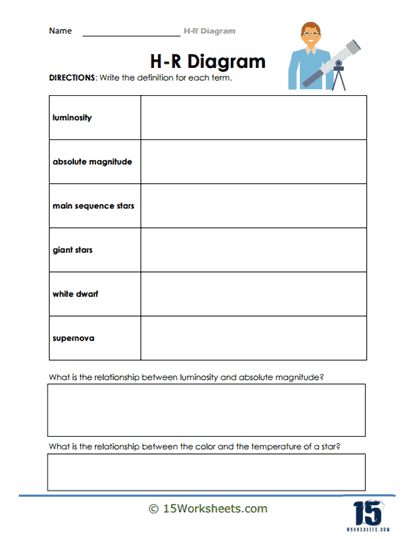
This worksheet likely challenges students to match word definitions or fill in blanks using vocabulary tied to stellar properties. It builds a strong foundation in star-related terminology. It’s a smart warm-up before students dive into plotting or analysis tasks. Great for getting comfortable with the lingo.
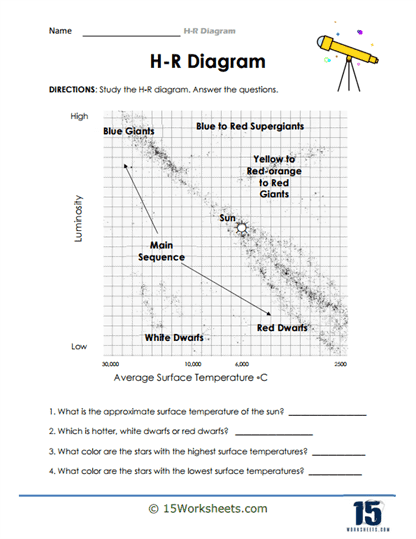
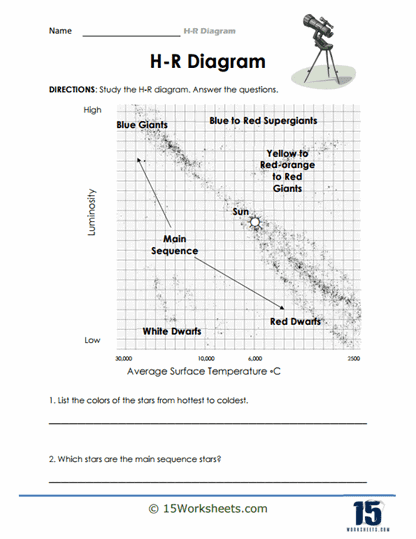
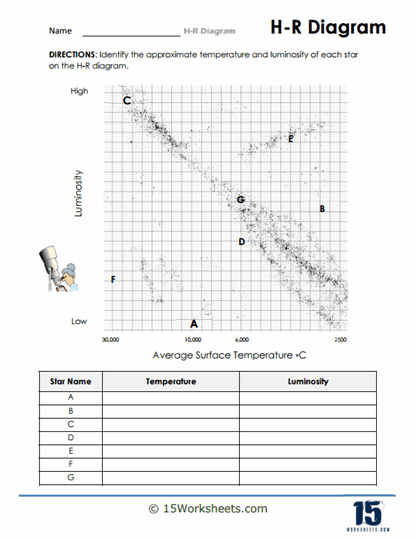
Reading H-R Diagrams
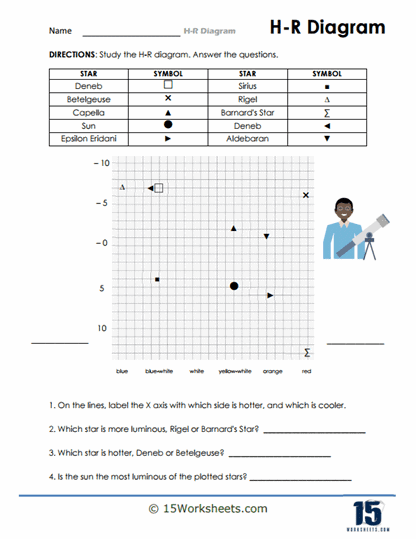
Students interpret existing H-R diagrams-pointing out where different star types appear based on temperature and brightness. It turns charts into stories and helps learners make sense of why stars appear where they do. It sharpens reasoning and observation skills. A perfect step toward deeper astronomy understanding.
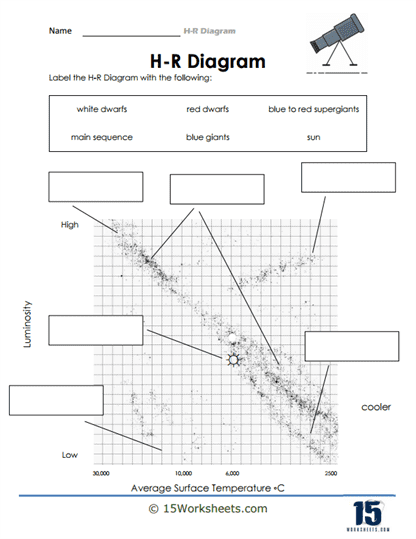
Label the H-R Diagram
In this activity, learners label diagram regions (e.g., “main sequence,” “white dwarfs,” “supergiants”) and possibly mark key stars like the Sun. It reinforces spatial understanding of the H-R layout. Labeling supports visual memory and cements how different stars cluster. A useful bridge between concept and chart.
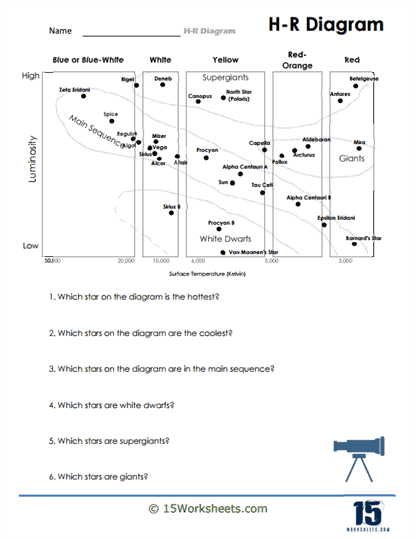
Studying H-R Diagrams
A closer look at diagram features-students compare zones, chart differences, and maybe discuss why some stars shine brighter or appear hotter. Encourages analysis and critical thinking. It deepens their familiarity with H-R mechanics. A more thoughtful, reflective worksheet.
Surface Temperature and Luminosity
Students explore how a star’s brightness relates to surface temperature, possibly through graphs or matching tasks. It’s conceptual and quantitative, reinforcing how these two variables interact. Encourages scientific reasoning through observation. A key piece in understanding stellar classification.
Types and Colors of Stars
This task likely has students categorize stars by spectral class (like blue giants versus red supergiants) based on color, then place them on the diagram. It connects physical traits with classification. Great for exploring the visible diversity of stars. Adds color-and context-to astronomical learning.
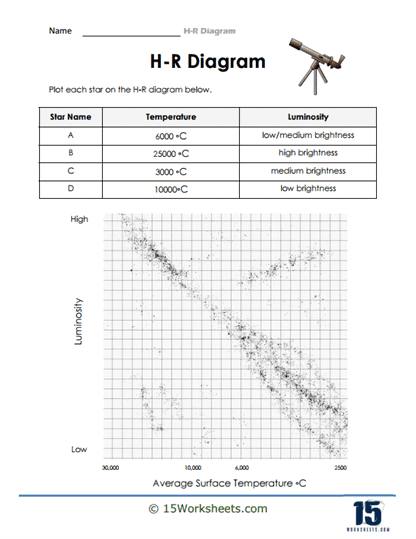
4 Star Plots
Learners plot four stars using provided data and identify each on the H-R diagram. This builds precision and plotting confidence in a clear visual way. Hands-on work makes learning stick better than reading alone. Quick, focused, and very satisfying to complete.
Temperature and Brilliance
Students connect surface temperatures with brightness levels-possibly using charts or matching tasks. It reinforces the inverse or direct relationships often found in star classification. This worksheet ties number and concept neatly together. It’s a shining way to wrap their heads around H-R dynamics.
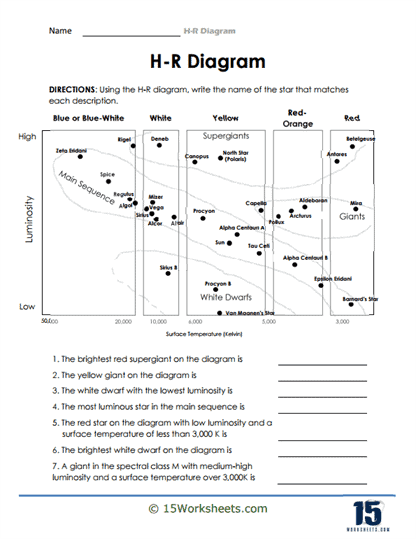
Naming Stars
Students may identify or research star names (like Betelgeuse or Sirius) and place them on the diagram. It brings a human (or mythical) element to astronomy. Names make the cosmos feel more familiar and memorable. Plus, it adds fun “celebrity” recognition to the charts.
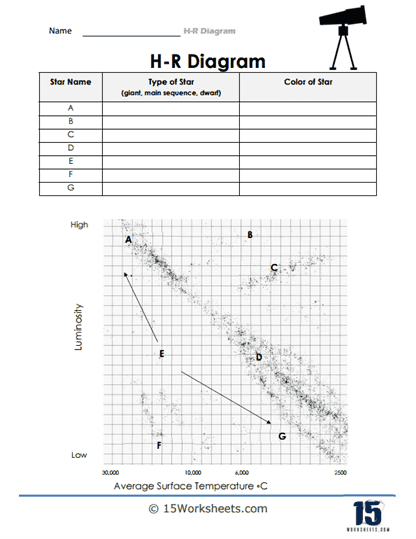
Full Star Evaluation
Here, learners may analyze a star’s properties fully-temperature, luminosity, classification-then place it correctly on the diagram. It’s a comprehensive synthesis of all prior skills. This worksheet pushes for deeper mastery. A stellar finale to the unit.
Plotting Stars
A more advanced plotting activity involving multiple stars and perhaps comparative analysis (e.g., “Which star is brightest?” or “Which is hottest?”). Builds precision and deeper chart-reading. Great for reinforcing earlier skills in a single challenge. Engaging and integrative.
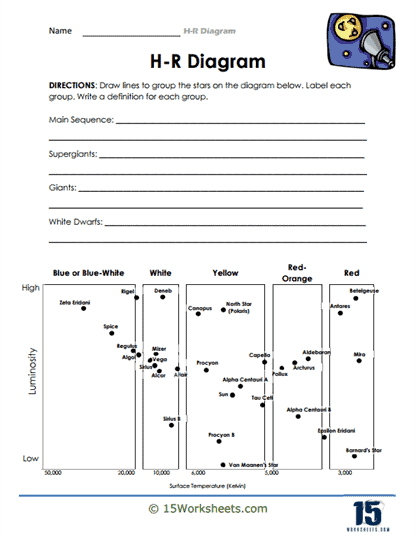
Groups of Stars
Learners group stars (perhaps by category or region on the diagram)-like clustering main sequence stars or giants. It emphasizes patterns and helps visualize classification. Ideal for exploring how stars share traits and space. A group activity for collective learning.
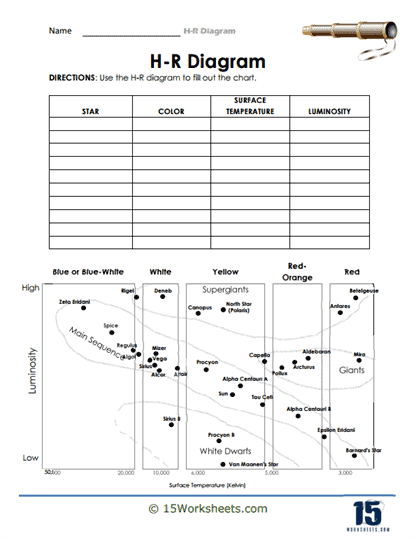
Chart Fills
This activity likely involves completing parts of the H-R chart-filling in missing labels, axes, or data points. It reinforces structure and ensures understanding of diagram anatomy. Like coloring within the lines, but with science! A fun wrap-up tool to check comprehension.
What Are H-R Diagrams?
The Hertzsprung-Russell (H-R) diagram is a scatter plot of stars showing the relationship between their absolute magnitudes (luminosities) and spectral types (or surface temperatures). It is named after its creators, Ejnar Hertzsprung and Henry Norris Russell, who independently developed the diagram in the early 20th century.
H-R diagrams are important tools in astronomy because they allow us to classify stars according to their properties and evolutionary stages. By plotting the data for a large number of stars on an H-R diagram, we can see patterns and trends that provide clues about how stars form, evolve, and ultimately die.
For example, stars that are located in the upper-left corner of the H-R diagram are hot and bright, while stars in the lower-right corner are cool and dim. This tells us that there is a relationship between a star’s temperature and its luminosity. We can also use H-R diagrams to identify different types of stars, such as main-sequence stars (like the Sun), red giants, and white dwarfs.
H-R diagrams are especially useful for studying star clusters, where all the stars have similar ages and compositions. By comparing the positions of stars in a cluster on an H-R diagram with theoretical models of stellar evolution, astronomers can learn a great deal about the physical properties of stars and how they change over time.