Plotting Stars
Worksheet Description
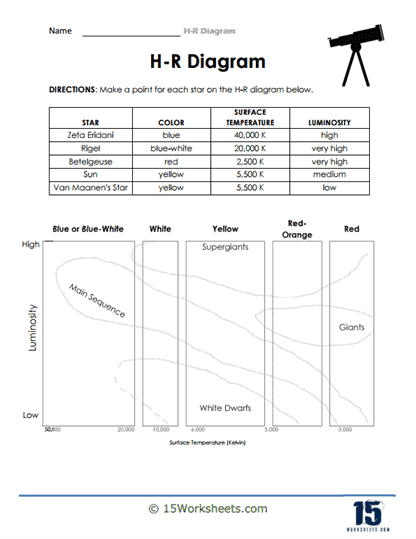
On the worksheet, specific stars are listed with their respective colors, surface temperatures, and luminosity levels. Using this data, students are required to locate and plot each star on the accompanying H-R Diagram. This task encourages learners to synthesize information about a star’s characteristics to determine its appropriate position on the diagram.
To effectively tackle this worksheet, students should begin by understanding the axes of the H-R Diagram: the horizontal axis represents surface temperature, while the vertical axis illustrates luminosity. It’s important to note that on the temperature axis, hotter stars are plotted towards the left, and cooler stars towards the right. Using the data provided for each star, learners should then identify its color, match it with its temperature, and locate its approximate position on the horizontal axis. Next, based on the star’s luminosity level, they should place the star on the vertical axis, thus plotting its position on the H-R Diagram.
Through this worksheet, students are introduced to the intricate relationships between a star’s color, temperature, and luminosity, all essential aspects of stellar classification. The exercise is designed to instill observational and analytical skills, guiding students to discern patterns and relationships within the data and the H-R Diagram. By plotting stars on the chart, learners witness firsthand how various stars, including our Sun, relate to each other in the grand scheme of stellar classification. Ultimately, the goal is to offer students a practical application of theoretical knowledge, fostering a deeper comprehension of the vast and diverse universe of stars.