Label the H-R Diagram
Worksheet Description
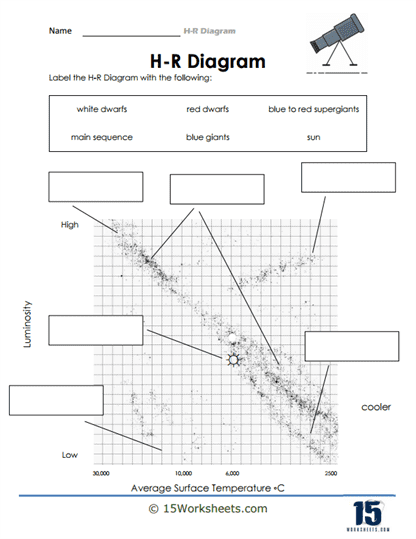
Displayed on a graph, different stars are plotted according to their respective colors (temperatures) and absolute magnitudes (luminosities). Accompanied by a table listing various stars and their corresponding symbols, the students are required to analyze the H-R Diagram and answer questions about the relative temperatures and luminosities of specific stars. A character holding a telescope serves as a visual reminder of the observational nature of this scientific endeavor.
To adeptly navigate this worksheet, students should first familiarize themselves with the table denoting each star and its associated symbol. They should then scrutinize the H-R Diagram, pinpointing the positions of each star based on its given symbol. Using the graph’s axes – which indicate temperature (color) and luminosity (absolute magnitude) – students can deduce the temperature and luminosity characteristics of each star. Equipped with this information, they can proceed to answer the subsequent questions by making direct comparisons between the positions of the mentioned stars on the graph.
The primary objective of this worksheet is to cultivate a solid understanding of the Hertzsprung-Russell Diagram among students and instill the capability to interpret its information. By engaging with the graph and answering comparative questions, students enhance their skills in reading and deciphering astronomical data. The worksheet prompts critical thinking, as it demands that students make astute observations and draw conclusions about the properties of stars based on their positions on the H-R Diagram. Through this hands-on experience, students grasp the essence of stellar classification and the fundamental concepts of temperature and luminosity in astronomy.