Reading H-R Diagrams
Worksheet Description
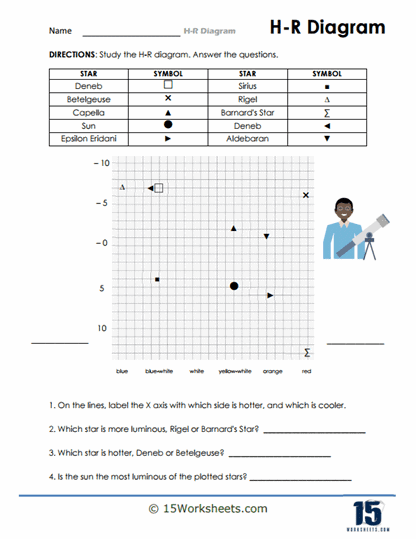
On this worksheet you will evaluate a typical H-R Diagram.
To read an H-R diagram, follow these steps:
- Understand the axes: The horizontal axis of an H-R diagram shows the star’s temperature or spectral class, with the hottest stars on the left and the coolest stars on the right. The vertical axis shows the star’s luminosity or absolute magnitude, with the most luminous stars at the top and the least luminous stars at the bottom.
- Locate the main sequence: The majority of stars in the universe fall along a diagonal band on the H-R diagram known as the main sequence. This band runs from the upper left (hot and bright) to the lower right (cool and dim).
- Identify other star types: Stars that are not on the main sequence can be found in other regions of the H-R diagram. For example, red giants are located in the upper right corner of the diagram, while white dwarfs are located in the lower left corner.
- Use the color-coding: Most H-R diagrams color-code the stars based on their spectral class. The colors range from blue (hot) to red (cool), with intermediate colors like yellow, orange, and white in between. This color-coding can help you quickly identify the temperature of a star.