Making Points

Worksheet Description
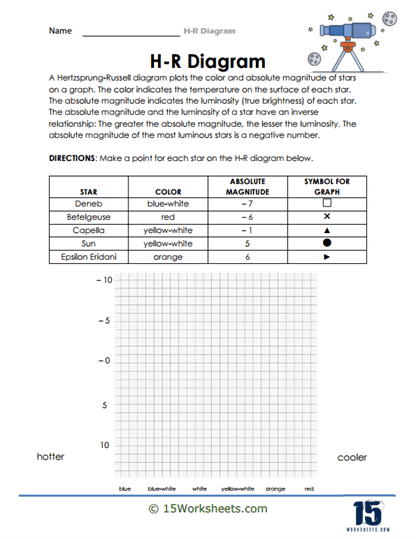
A Hertzsprung-Russell diagram plots the color and absolute magnitude of stars on a graph. The color indicates the temperature on the surface of each star. The absolute magnitude indicates the luminosity (true brightness) of each star. The absolute magnitude and the luminosity of a star have an inverse relationship: The greater the absolute magnitude, the lesser the luminosity. The absolute magnitude of the most luminous stars is a negative number.
To use this worksheet, one must follow the directions provided. Begin by examining the table which lists stars, their colors, and their absolute magnitudes, along with corresponding symbols for graphing. For each star, locate its color (temperature) on the x-axis and its absolute magnitude (luminosity) on the y-axis. Mark the intersection of these two values with the symbol specified for that star, effectively plotting it on the H-R Diagram.
This worksheet aims to educate students about the fundamental properties of stars and their categorization using the H-R Diagram. Through this exercise, students will understand the inverse relationship between a star’s absolute magnitude and its luminosity. By plotting stars on the diagram, they’ll visualize the different groups or types of stars, such as main-sequence stars, giants, and supergiants. Overall, this activity offers a hands-on approach to grasping essential concepts in astronomy.
