Temperature and Brilliance
Worksheet Description
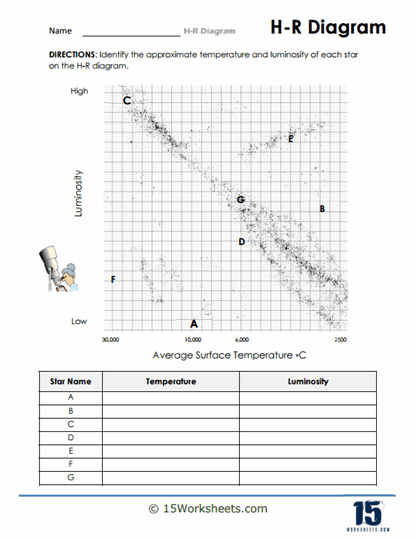
In this activity, seven stars are already plotted on the diagram, labeled from A to G. Students are tasked with determining and noting down the approximate temperature and luminosity of each star based on its position on the H-R Diagram. The provided chart features a clear x-axis representing average surface temperature and a y-axis for luminosity, aiding students in deducing the characteristics of the stars.
To accomplish this task, students should first select a star from the H-R Diagram. Observing its position on the x-axis will give them a good estimate of the star’s temperature. Similarly, by noting its location on the y-axis, students can deduce its luminosity. After determining these values, students can record them in the table next to the corresponding star’s name, and repeat this process for all the plotted stars.
The primary objective of this worksheet is to equip students with the skills to interpret and utilize the H-R Diagram, an indispensable instrument in understanding the diverse universe of stars. It challenges students to reverse-engineer the process – instead of plotting the stars based on provided data, they extract data based on plotted positions. This activity is designed to foster analytical skills, precision, and a deeper appreciation for how astronomers classify and understand stars. By the end, students should have a more concrete grasp of the relationship between a star’s temperature, its brightness, and how these attributes can be visually represented on the H-R Diagram.