Studying H-R Diagrams
Worksheet Description
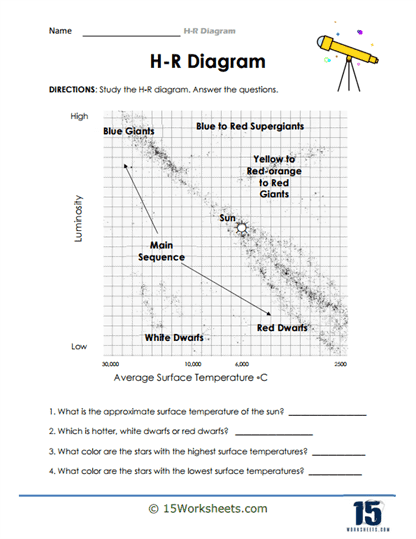
Detailed labels categorize various types of stars, such as Blue Giants, White Dwarfs, and Main Sequence stars, to name a few. The Sun is explicitly pinpointed on the diagram, serving as a reference point for students. Accompanying the diagram are questions aimed at evaluating students’ comprehension of the graphical information and their ability to determine the properties of different stellar categories.
To proficiently tackle this worksheet, students should start by closely studying the H-R Diagram, ensuring they understand the relationship between the x-axis (average surface temperature) and the y-axis (luminosity). After absorbing the general layout, they should focus on the labeled star categories to comprehend their distinct positions on the graph. The position of the Sun can be used as a standard reference to gauge the relative temperature and luminosity of other stars. Once familiarized with the diagram, students should utilize their observations and knowledge to address the questions provided, extracting relevant data directly from the graph where necessary.
The central goal of this worksheet is to deepen students’ comprehension of the Hertzsprung-Russell Diagram and the categorization of stars based on their inherent properties. Through this exercise, learners are exposed to the diverse types of stars that populate our universe and the criteria that astronomers use to classify them. By engaging with the questions, students sharpen their analytical skills, as they are required to draw meaningful conclusions about stellar attributes directly from the diagram. This hands-on approach ensures that students not only learn the theoretical aspects of stellar classification but also gain practical experience in interpreting real astronomical data.