4 Star Plots
Worksheet Description
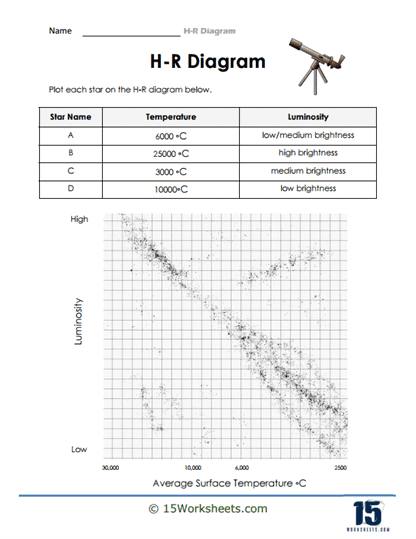
Students are provided with a list of four stars, each characterized by its temperature and luminosity, and are then tasked with plotting these stars onto the H-R Diagram. The chart features an x-axis depicting average surface temperature and a y-axis showcasing luminosity, providing reference points for the students’ plotting. The primary goal is for students to translate the given data of each star into a visual representation on the diagram.
To proficiently complete this exercise, students should begin by observing the H-R Diagram’s axes, internalizing the temperature gradient on the x-axis and the luminosity scale on the y-axis. Using the table, they can pinpoint the temperature for each star and find its corresponding location on the horizontal axis. Subsequently, based on the luminosity data provided for the star, they should locate the appropriate luminosity level on the vertical axis. Where these two points intersect – temperature and luminosity – is where the student should plot the star, repeating this for all stars in the table.
The worksheet aims to cultivate students’ analytical skills in interpreting and using the H-R Diagram, a crucial tool for understanding the vast array of stars in our universe. Through this activity, students grapple with the direct relationship between a star’s temperature and its brightness, learning to visualize and plot these correlations on the chart. Additionally, the exercise underscores the importance of precision and attention to detail, as slight variances in plotting can classify a star differently. By the end of this worksheet, students should have a foundational grasp of how astronomers categorize stars and the significance of the H-R Diagram in this process.