Surface Temperature and Luminosity
Worksheet Description
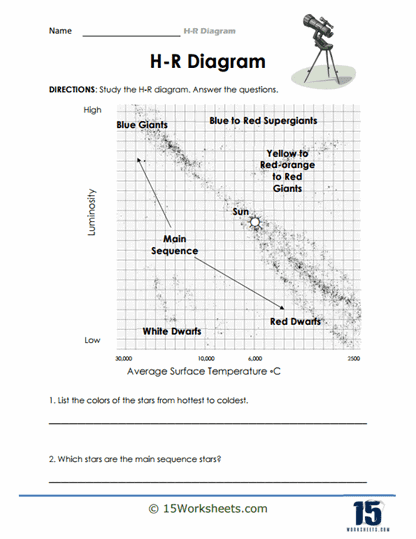
With a clear representation of various star types like Blue Giants, White Dwarfs, and the Main Sequence, the diagram prominently marks the Sun, serving as a tangible point of reference. The worksheet’s queries focus on extracting specific details about star colors in relation to temperature and pinpointing the Main Sequence stars. Such questions guide students in drawing meaningful insights directly from the diagram.
To adeptly navigate this worksheet, students should commence by thoroughly examining the H-R Diagram to grasp the correlation between the x-axis, representing average surface temperature, and the y-axis, denoting luminosity. The categorized star types should be noted, especially their positions relative to one another on the diagram. Utilizing the Sun’s marked position can assist students in gauging the properties of other stars comparatively. Upon familiarization, the students can then address the accompanying questions, pulling relevant information straight from the diagram to frame their answers.
The overarching objective of this worksheet is to deepen students’ understanding of the Hertzsprung-Russell Diagram and how astronomers classify stars based on their inherent characteristics. Engaging with the chart and accompanying questions, students familiarize themselves with the diverse classifications of stars and their placement within the universe. The worksheet is designed to hone students’ analytical prowess, prompting them to infer details about stellar attributes directly from a graphical representation. Overall, this activity melds theoretical knowledge with practical skills, ensuring a comprehensive grasp of stellar classifications and the H-R Diagram’s significance.