Chart Fills
Worksheet Description
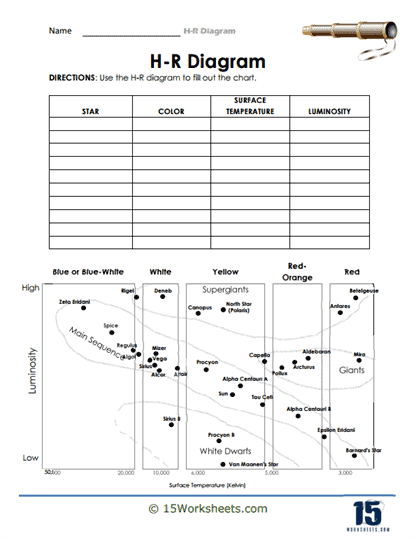
The main activity directs students to observe the diagram and utilize it to complete a chart detailing the color, surface temperature, and luminosity of specific stars. A selection of stars is presented on the H-R Diagram, but they are not directly labeled within the accompanying chart, thus challenging the students to use their observational and analytical skills.
To effectively tackle this task, students should first familiarize themselves with the H-R Diagram’s axes, understanding that the vertical axis represents luminosity while the horizontal axis indicates temperature. With this foundation, they can pinpoint a star on the diagram and discern its color range based on its position. Similarly, by observing the star’s location, they can deduce its approximate surface temperature and luminosity. Recording these details into the chart will require careful analysis and cross-referencing with the diagram.
The worksheet is designed to instill in students a practical understanding of the H-R Diagram, one of astronomy’s quintessential tools. By transcribing visual data from the diagram into the structured format of a chart, learners are practicing the skill of data interpretation. Furthermore, the exercise aids students in recognizing the relationships between a star’s color, temperature, and luminosity. In essence, this hands-on approach is intended to provide students with a deeper comprehension of stellar classification and the inherent characteristics that define different stars.