Triple Bar Graphs Worksheets
About These 15 Worksheets
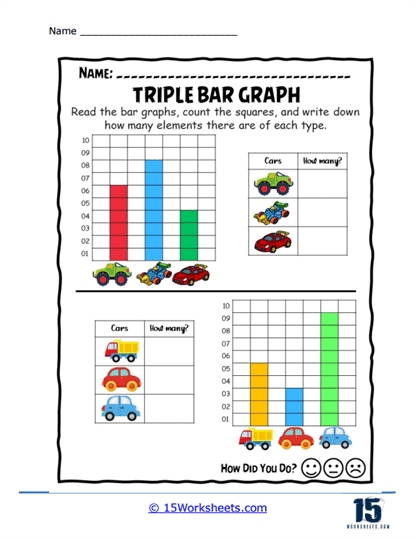
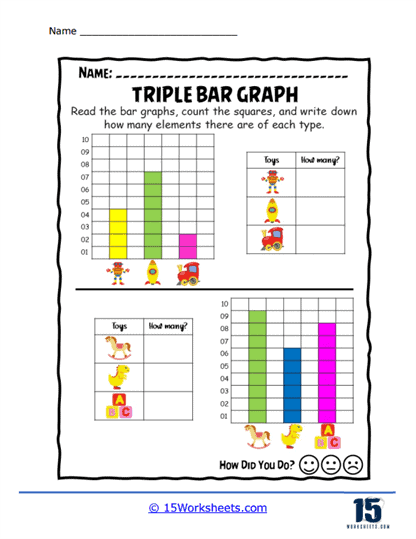
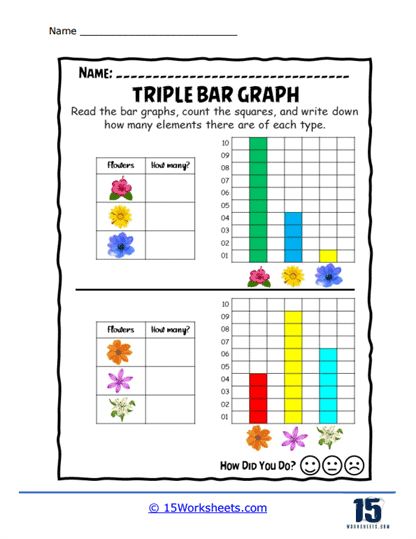
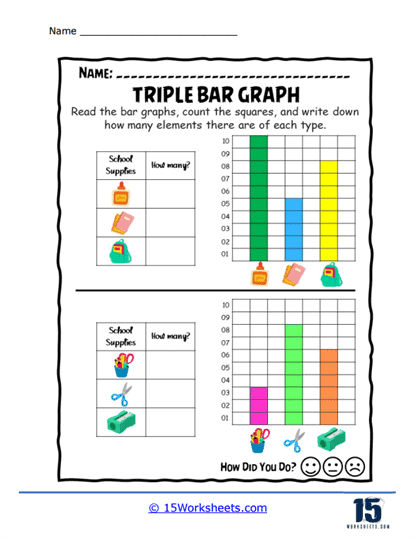
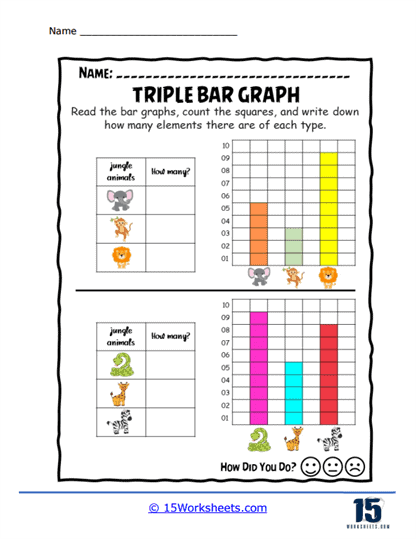
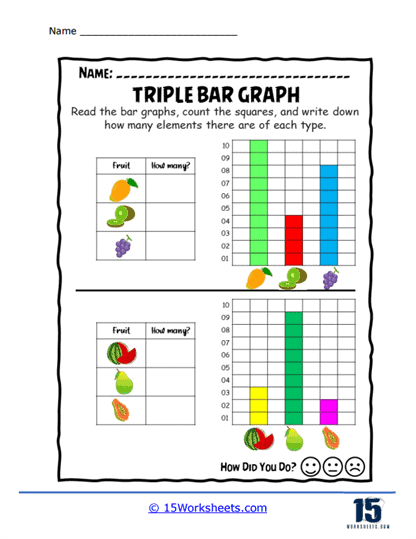
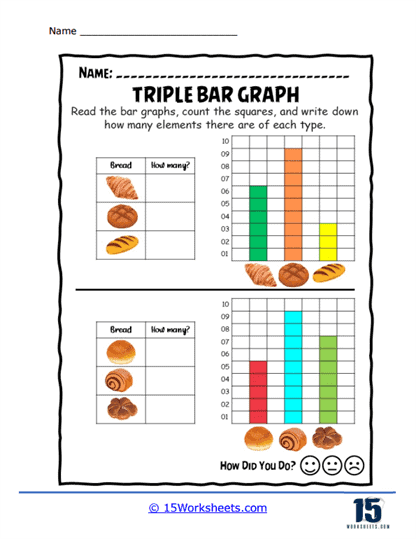
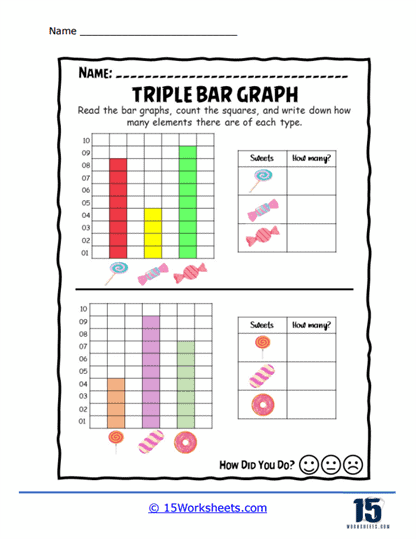
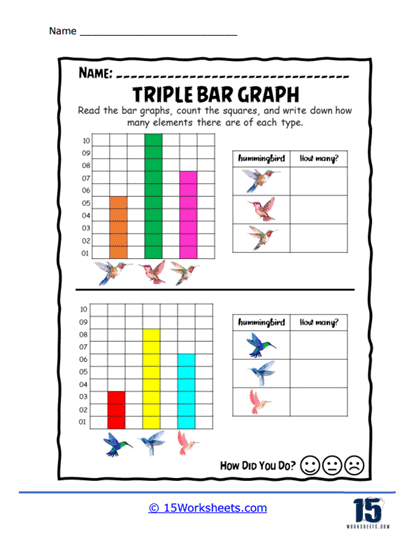
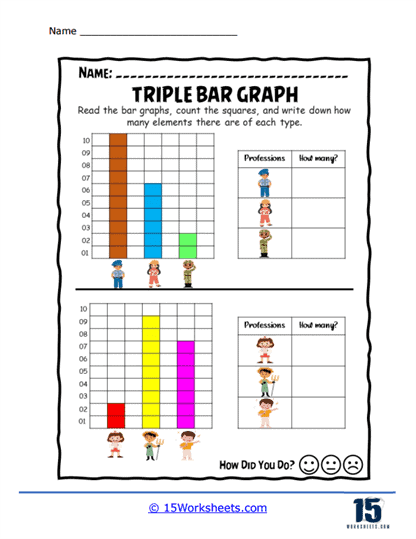
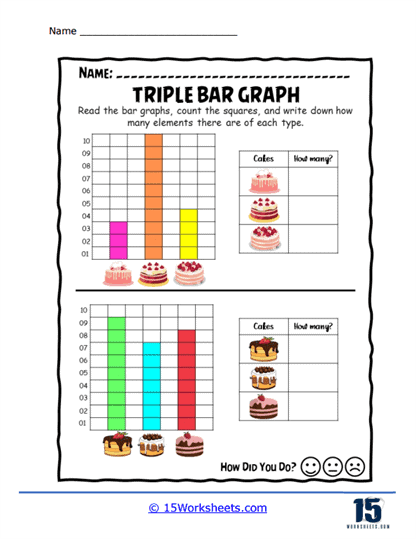
These worksheets can helps student visualize and analyze three related sets of data simultaneously. These worksheets take the concept of the traditional bar graph and extend it by allowing the comparison of three data points across various categories. Each set of data is represented by a different color or pattern, making it easy to distinguish between the three groups. This format is particularly useful for helping students develop their ability to compare and contrast multiple data sets, identify trends, and draw meaningful conclusions from the information presented.
One of the most common features of these worksheets is the section where students are asked to interpret a pre-drawn graph. These graphs typically include three sets of data for various categories, such as the test scores of three different classes, the sales of three different products across several months, or the preferences of three different age groups for various activities. Students are often required to answer questions based on the graph, such as which group had the highest value in a particular category, which category showed the most significant difference between the groups, or how the trends in the data change over time. These interpretation exercises help students practice essential skills like reading and understanding data, recognizing patterns, and making inferences based on the visual information presented.
Another critical component of the worksheets is the opportunity for students to create their own graphs. In these exercises, students are typically given a set of raw data in a table format and are asked to translate that data into a triple bar graph. This process involves selecting appropriate scales, labeling the axes correctly, and drawing the bars to accurately represent the data. Creating graphs from scratch reinforces students’ understanding of the relationship between the data and its visual representation, and it requires careful attention to detail. This type of activity also helps students develop a more profound understanding of how different values compare within the same category and across different categories, fostering critical thinking and precision in their work.
These worksheets often include comparative analysis tasks where students are asked to compare the three data sets directly. For example, a worksheet might present a graph showing the popularity of three different ice cream flavors among children, teenagers, and adults. Students might then be asked to determine which age group prefers a specific flavor the most, or which flavor is the most popular across all age groups. These types of questions require students to engage in deeper analysis, moving beyond simple observation to draw comparisons and make judgments based on the data. This level of analysis helps students develop their analytical thinking skills, as they must process multiple pieces of information simultaneously and understand how they relate to one another.
Some of the worksheets incorporate real-world scenarios that require students to apply their graphing skills in practical contexts. For example, a worksheet might present data related to the energy consumption of three different types of appliances in a household, and students might be asked to analyze which appliance consumes the most energy over time. Another example could involve comparing the revenues of three different companies across several years to identify trends and make predictions about future performance. These real-world applications help students see the relevance of the skills they are learning and demonstrate how these skills can be applied in everyday life. Understanding how to analyze and compare multiple sets of data is a valuable skill in many fields, including business, science, and economics, where making informed decisions based on data is crucial.
The worksheets also include questions that encourage students to reflect on the implications of the data they are analyzing. For example, after interpreting a graph showing the test scores of three different classes, students might be asked to consider why one class performed better than the others or what factors might have contributed to the differences in performance. These reflective questions help students develop a deeper understanding of the data by encouraging them to think about the underlying causes and effects. This type of critical thinking is essential in the real world, where simply identifying trends is not enough-understanding why those trends occur and what they mean is key to making informed decisions.
In addition to teaching students how to create and interpret triple bar graphs, these worksheets also reinforce fundamental math skills like addition, subtraction, multiplication, and division. For example, students might need to add the values of the three bars in a particular category to determine the total, or they might be asked to subtract one value from another to identify the difference between the groups. These basic arithmetic operations are crucial for accurately analyzing data, and practicing them in the context of graphing helps students become more comfortable with using math in practical situations. By regularly engaging with these types of worksheets, students strengthen their ability to perform calculations quickly and accurately, which is a valuable skill in both academic and real-world settings.
Thee types of worksheets include tasks that involve making predictions based on the data. For example, students might be asked to predict which group will have the highest value in the next time period based on the trends shown in the graph. These prediction tasks help students develop their ability to analyze trends and make informed guesses about future outcomes. This skill is particularly important in real-world situations, where the ability to predict future trends based on current data can be crucial in fields like finance, marketing, and economics. Learning how to make predictions based on data helps students understand the importance of trends and how they can be used to inform decision-making.
After analyzing a graph, students might be asked to write a short paragraph explaining what the graph shows or to present their findings to the class. This type of activity helps students develop their ability to articulate their thoughts clearly and to use evidence from the graph to support their conclusions. Communication skills are essential in the real world, where the ability to present data and explain its significance is crucial in many professions. By practicing these skills in the context of graphing, students become more confident in their ability to analyze data and communicate their findings effectively.
These worksheets often include exercises that help students develop their ability to evaluate the reliability and validity of the data they are analyzing. For example, a worksheet might present a graph showing the results of a survey conducted with a small sample size and ask students to consider whether the data accurately represents the larger population. This type of exercise helps students develop critical thinking skills by encouraging them to question the quality of the data and to consider factors like sample size, bias, and data collection methods. Understanding how to evaluate data critically is a valuable skill in the real world, where making decisions based on unreliable data can have serious consequences.


