Toy Towers
Worksheet Description
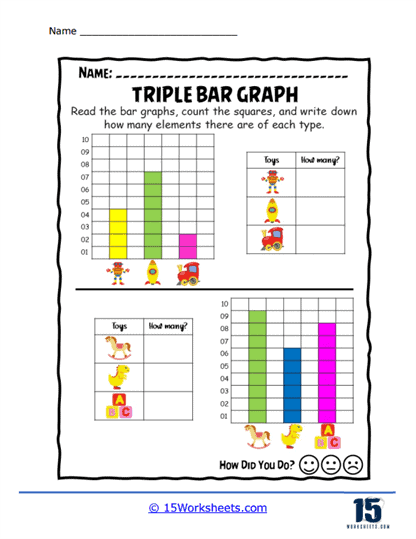
This worksheet presents two triple bar graphs, each representing different types of toys. Students are instructed to read the bar graphs, count the squares corresponding to each type of toy, and then record the total number in the provided boxes. The bars are color-coded to help students easily distinguish between the various toys depicted. This activity combines a playful theme with educational content, allowing students to practice their graph-reading and counting skills in a fun and engaging way.
The worksheet is designed to teach students how to accurately interpret triple bar graphs, with a focus on extracting and comparing data from visual representations. By counting the squares in each bar, students learn to associate the height of the bars with the actual quantities of toys represented. This exercise reinforces the importance of precision and attention to detail, as students must carefully analyze the graphs to ensure their counts are correct. Additionally, the activity helps students develop logical thinking and accuracy, essential skills for both academic success and real-world applications. Through this hands-on approach, students build confidence in working with graphs and applying their math skills to practical, everyday situations involving data analysis.