Graphing Worksheets
About Our Graphing Worksheets
Graphing is one of the most important ways students learn to organize information, recognize patterns, and make sense of data in the world around them. Whether they are reading bar graphs, plotting points on a coordinate plane, or comparing information through charts and tables, these activities help students build strong analytical and problem-solving skills while making math feel more visual and interactive. For many learners, graphing creates a bridge between abstract math concepts and practical real-world applications they can actually relate to and understand.
Our graphing worksheets are designed to give students plenty of hands-on practice with a wide variety of graphing concepts, from basic pictographs and tally charts to more advanced topics like histograms, coordinate planes, and graphing lines. Teachers and parents love using these resources because they encourage students to slow down, interpret information carefully, and explain their thinking in meaningful ways. With engaging exercises that support both foundational and higher-level math skills, this collection helps students grow more confident in reading, creating, and analyzing all types of graphs and data displays.
A Look At The Categories
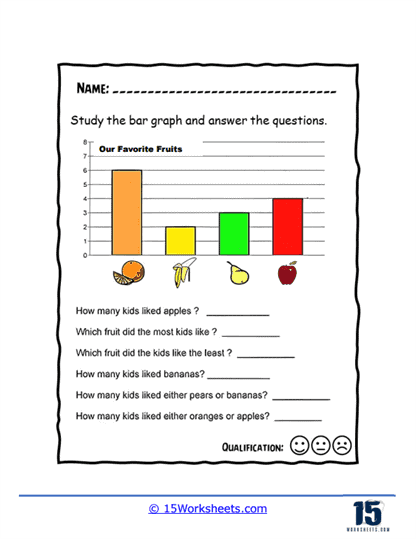
Useful for presenting and comparing data in a visually clear manner, students explore how to read and interpret bar graphs through this series of worksheets. With a variety of topics, including data analysis and problem-solving, students get ample practice in mastering this math skill and develop their graphing abilities.
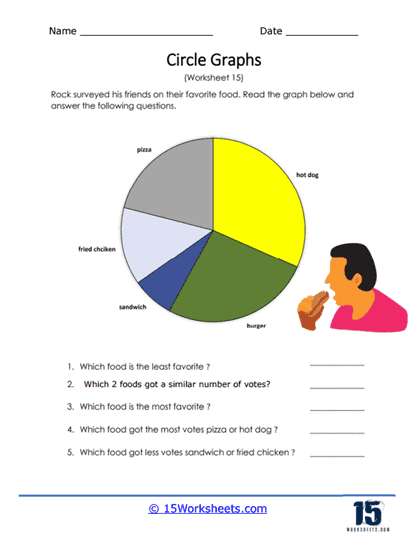
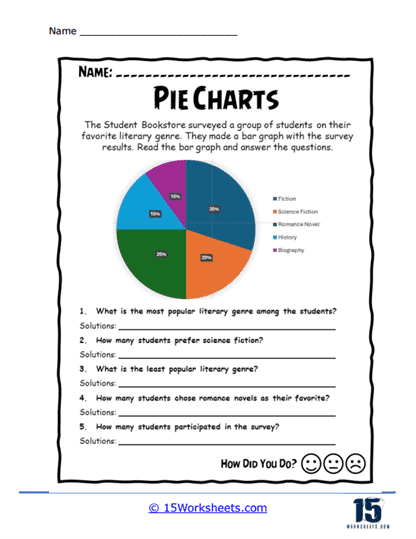
More popularly known as pie charts, circle graphs display data in the form of a circle divided into sectors or “slices.” Through these worksheets, students practice analyzing data shown in circle graphs and creating their own to reflect accurate empirical data.
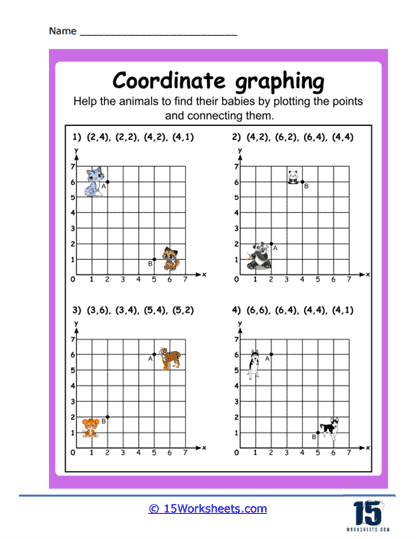
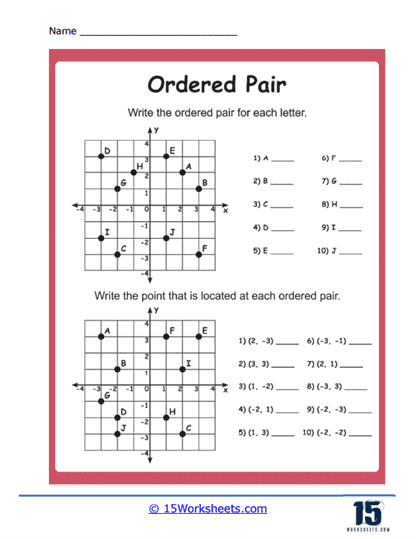
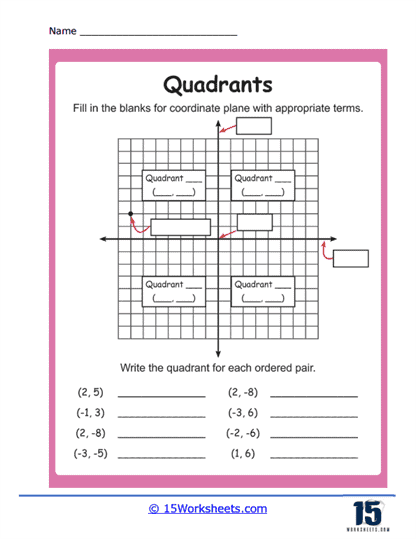
This collection of sheets helps reinforce concepts related to the coordinate system, improve graphing skills, and build a foundation for understanding algebra and geometry. You will practice graphing points, lines, and shapes on a two-dimensional grid known as the coordinate plane.
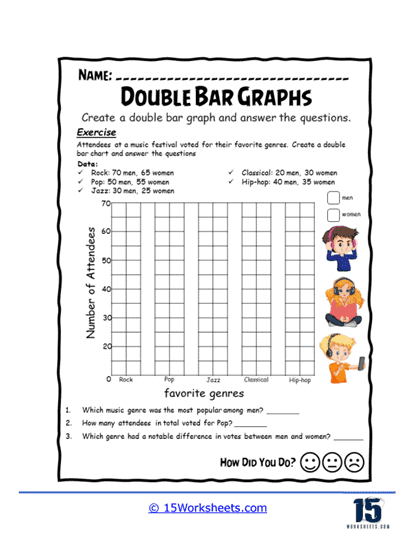
These activities help students compare two sets of information at the same time, which is a great way to build stronger observation and thinking skills. I like using these because kids start noticing patterns and differences naturally while working with data that feels much more real and relatable.
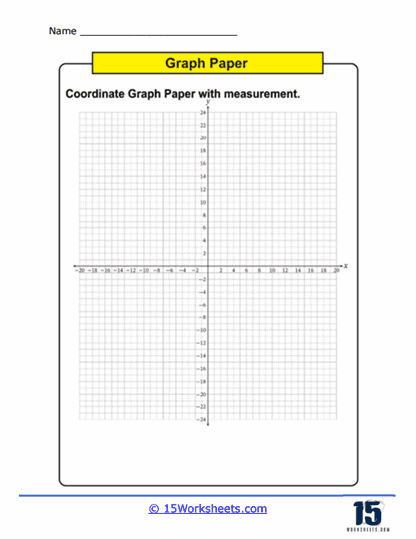
Graph paper gives students a clean and organized space to work through math problems, draw shapes, and create accurate graphs. It may seem simple, but having that structure really helps students stay neat, line things up correctly, and feel more confident with their work.
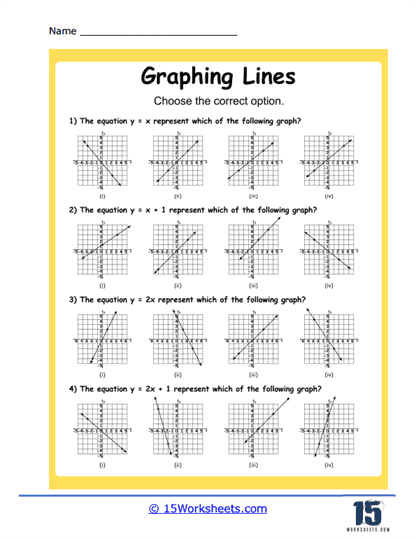
Help students grasp the concepts of linear equations and how they relate to graphs. As they work through these worksheets, students will develop the skills to confidently graph lines and recognize the connections between equations and their visual representations.
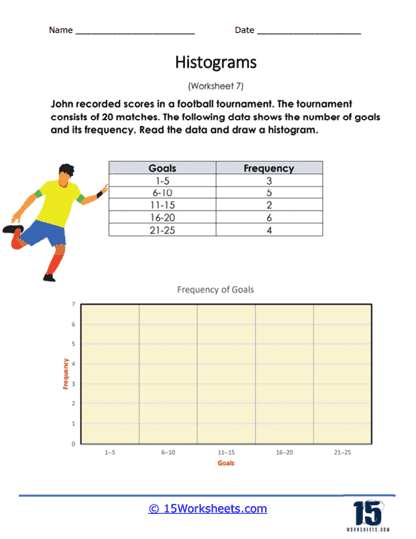
This series of worksheets provides a variety of exercises to help students understand how to read and create histograms, and interpret data from them. With a focus on topics like frequency distribution and central tendency, these worksheets help students further practice their graphing skills and gain a deeper understanding of data analysis.
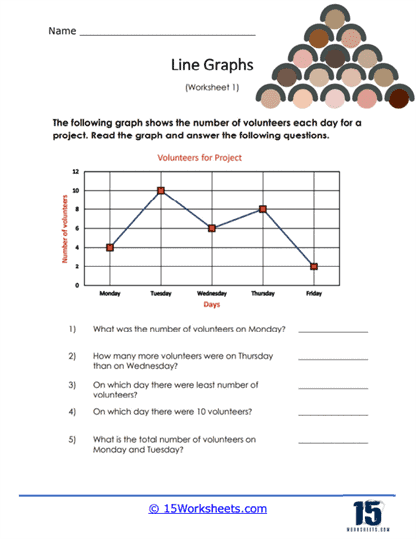
Data can change over time, and line graphs visualize this through points plotted on a two-dimensional plane. Through a wide variety of exercises that aims to practice students’ skills on data analysis and problem-solving, they gain a deeper understanding of trends and patterns in data as illustrated in a line graph.
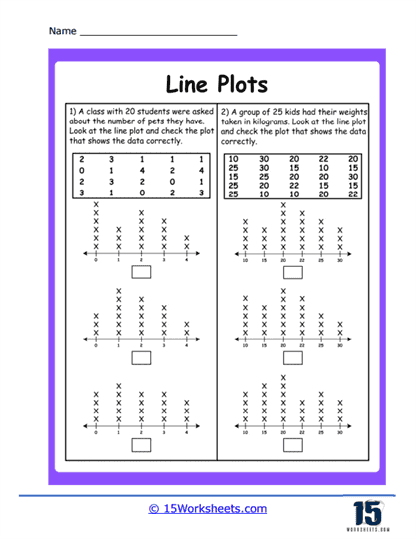
Line plots are a great way for students to practice organizing information and making sense of data in a visual way. Parents usually notice that these activities also help reinforce counting, fractions, and basic problem-solving without feeling overwhelming to students.
You will find that this series can improve students’ ability to think spatially, grasp the Cartesian coordinate system, and interpret graphical data. As students advance, these skills become essential for excelling in subjects like algebra, geometry, physics, and other areas that rely on graphing and spatial thinking.
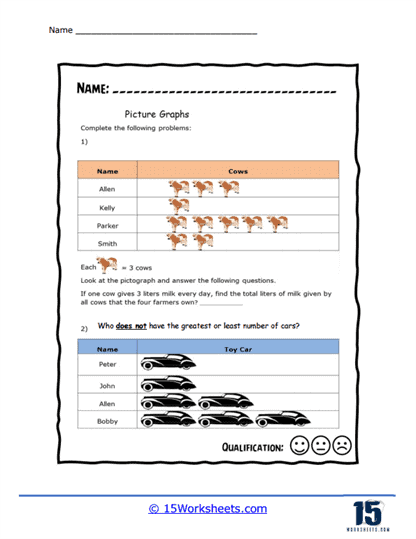
Pictographs are an effective way to convey simple data in a visually engaging and accessible manner. Through this series of free worksheets, students practice reading and interpreting data in pictographs through a comprehensive set of exercises.
These pages help students understand how parts make up a whole while introducing percentages and visual data in a very approachable way. I love using pie charts because they encourage students to talk through what they see and connect math to everyday situations.
By working on these exercises, students will gain a clear understanding of how the coordinate plane is organized and why the signs of x and y coordinates are important.
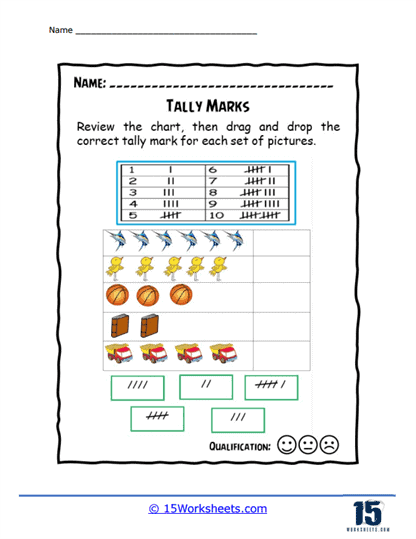
With a focus on topics like frequency and data organization, these worksheets offer ample practice for students to develop their data analysis skills and gain a deeper understanding of numerical representation. From reading and creating tally charts, to interpreting data from them, students gain mastery in using them for data analysis.
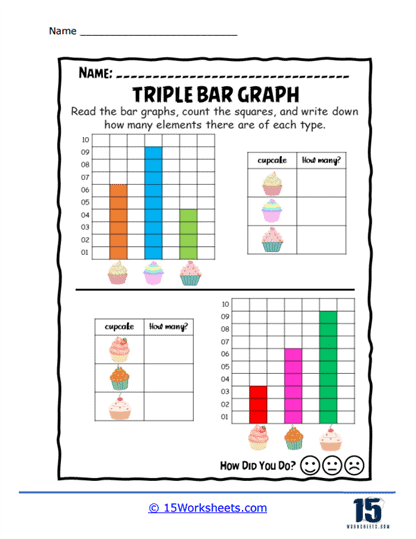
Triple bar graphs give students the opportunity to compare three groups of data at once, which adds a nice challenge as their skills grow. These activities really encourage students to slow down, pay attention to details, and explain what the information is showing in their own words.