Tally Charts Worksheets

About These 15 Worksheets
Imagine you are playing a game with your friends, let’s say a game of soccer in your backyard. You all decide to keep track of how many goals each of you scores. But, because you are playing and having fun, you can’t stop every time to write down each goal. So, you decide to make a small mark or line each time someone scores a goal. You make a group of five lines where the fifth line crosses the previous four, like a gate. This way, it’s easier to count, and you can just glance at your marks to know the scores. This marking system is what we call a ‘tally mark’ system.
Now, let’s imagine you want to study something interesting, like which type of ice cream is most liked by your classmates. You could ask each of them about their favorite flavor and use tally marks to note down their answers. You might use a piece of paper or a worksheet to do this. This is a tally chart worksheet. It helps you collect data, or information, in an organized way that is easy to understand.
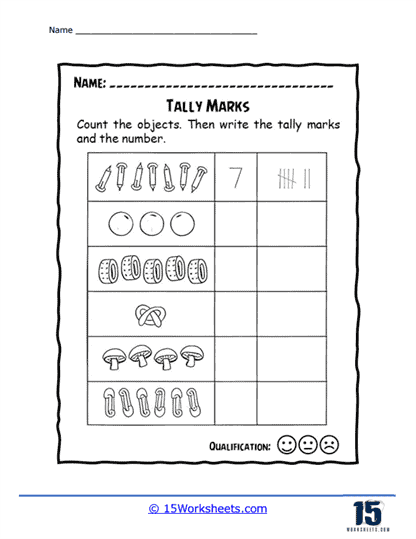
On the tally chart worksheet, you’d write the names of different ice cream flavors on one side and make tally marks for each flavor on the other side. For example, if 3 of your classmates like strawberry the best, you’d put 3 tally marks next to strawberry. If 5 friends prefer vanilla, then vanilla would get 5 tally marks. This process continues until you’ve asked everyone.
The cool thing about tally chart worksheets is that they make data more visual. Just like in your backyard soccer game, you can look at the tally chart and immediately see which flavor is the most popular among your classmates. It doesn’t require complex math skills, but it gives you very useful information.
Tally charts also make it easier to count larger numbers. Remember the group of five tally marks I mentioned before, where the fifth line crosses the previous four? That’s because our brain finds it easier to count in groups, especially groups of 5 or 10, rather than counting each individual mark. This way, even if you got 100 responses, you can count them quickly.
What Are Tally Charts?
Tally charts, also known as tally marks or simply tallies, are a simple and intuitive method for recording and counting the frequency of occurrences of particular events or items in a dataset. Tally charts are typically used to keep track of data in real-time or to count occurrences during data collection.
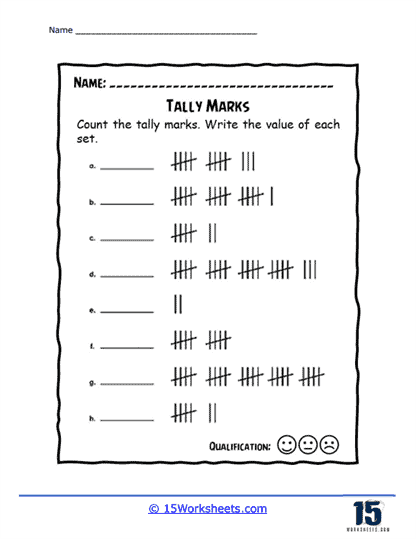
In a tally chart, a small vertical line or “tally mark” is drawn for each occurrence of an event or item. The tally marks are grouped in sets of five, with the fifth mark drawn diagonally across the previous four marks, forming a bundle. This grouping makes it easier to count the tallies quickly and accurately. The events or items being counted are usually listed along the left side of the chart, and the tally marks are placed in columns to the right of the corresponding event or item.
What Are They Useful For?
Collecting Data – Tally charts can be used to gather data during surveys, observations, or experiments, making it easy to record the frequency of occurrences or responses in real-time.
Organizing Data – Tally charts help organize raw data in a structured manner, making it easier to analyze and interpret the information.
Data Handling – Tally charts can be used as an educational tool to introduce students to basic data handling and counting techniques.
Visualizing Data – Although tally charts are not as visually informative as other types of graphical representations like bar graphs or pie charts, they can still provide a simple visualization of the frequency of occurrences in a dataset.
While tally charts are effective for simple data collection and counting tasks, they may not be the best choice for representing complex or large datasets, as other graphical representations like bar graphs, line graphs, or pie charts may provide a more detailed and visually appealing presentation of the data.
Introducing Them To Students
Introducing tally charts to students can be an engaging way to teach basic data handling, counting techniques, and data organization. Here are some steps and tips to help you introduce tally charts to students:
Explain the Purpose – Begin by explaining the purpose of tally charts as a simple and efficient way to record and count the frequency of occurrences or items in a dataset.
Demonstrate Using Tally Marks – Show students how to create tally marks and explain the grouping system. Teach them to draw vertical lines for the first four occurrences and then a diagonal line through those four marks for the fifth occurrence, creating a bundle of five.
Use Simple Examples – Use relatable examples to illustrate the use of tally charts. For instance, you can count the number of students wearing different colors of shirts, the types of pets students have, or the number of times a specific word is spoken in a conversation.
Hands-on Activities – Encourage students to create their own tally charts by collecting data on a topic of interest or from their surroundings. This could include counting the number of cars passing by during a certain time period or recording the types of snacks consumed by their classmates during lunch. Assign group tasks that involve using tally charts to collect and analyze data. This can help students develop teamwork skills and engage in peer learning. Use tally charts to reinforce other mathematical concepts like addition, subtraction, or basic statistics (e.g., finding the total, mean, mode, or range of the collected data).
By incorporating these steps and tips into your lessons, you can effectively introduce students to tally charts and help them develop valuable data handling and math skills.