Tape Diagrams Worksheets

About These 15 Worksheets
These worksheets are used to help students understand and solve problems involving ratios, proportions, fractions, and other numerical relationships in mathematics. These diagrams, also known as bar models, strip diagrams, or length models, visually represent problems by using bars to illustrate numbers and their relationships. This method is highly effective in breaking down complex word problems into more manageable parts, making it easier for students to apply their mathematical knowledge to find solutions.
Tape diagrams are particularly prominent in Singapore Math and other problem-solving based approaches to learning mathematics. The diagrams help students transition from concrete to abstract mathematical thinking by allowing them to visualize the components of the problem. This visualization is crucial in the development of a student’s ability to reason algebraically and to solve complex problems efficiently. Tape diagrams are versatile tools that can be adapted for a wide range of grade levels and mathematical concepts.
Types of Exercises
Basic Operations
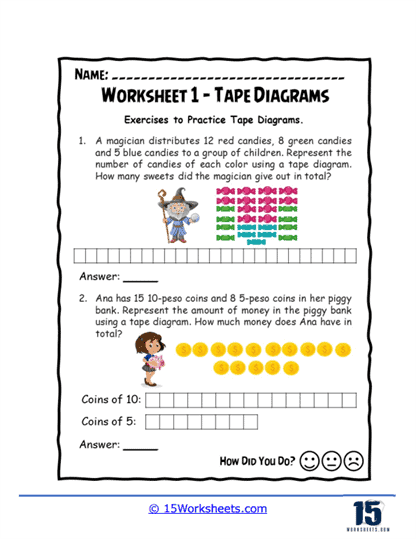
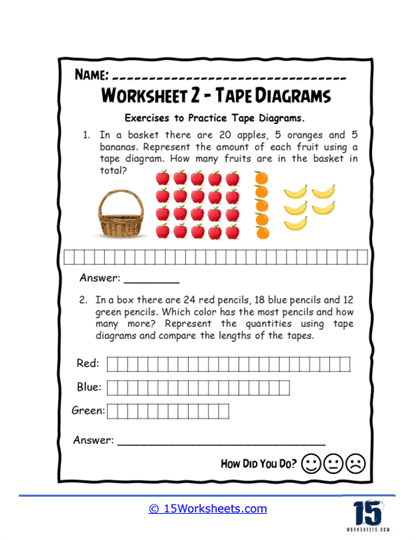
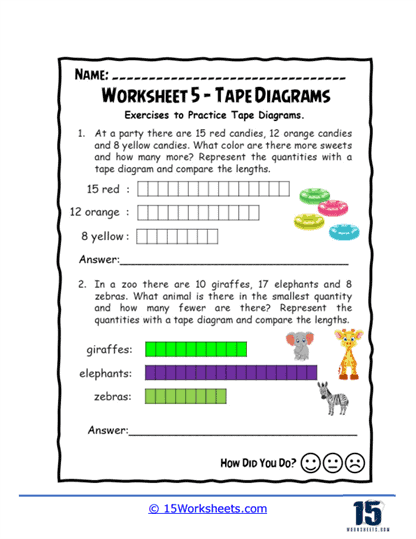
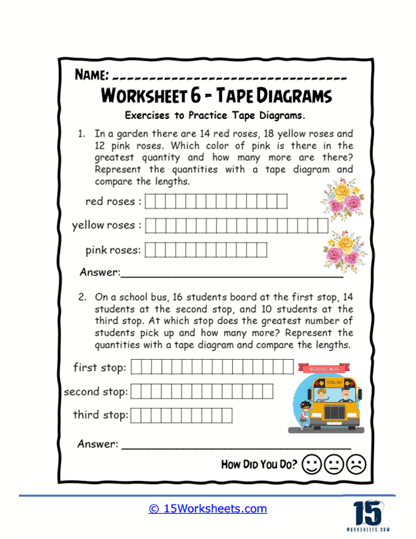
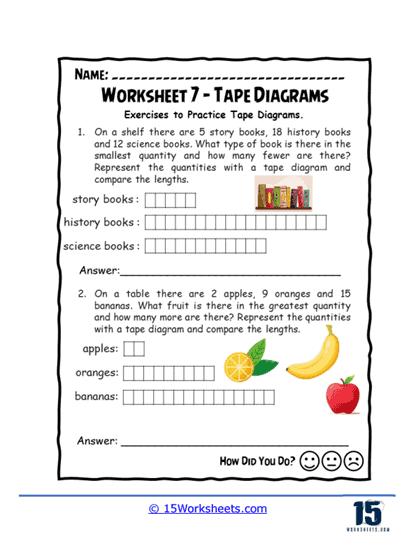
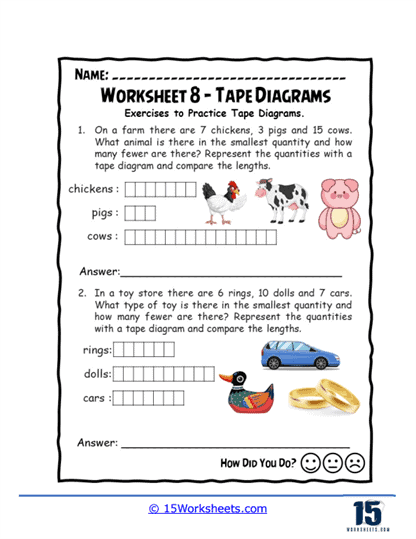
Early learners often use tape diagrams to understand addition and subtraction. These worksheets typically present simple scenarios where students use the lengths of the bars to represent quantities. By comparing and manipulating these lengths, students can visually solve problems and understand the concepts of adding to, taking from, putting together, and comparing with unknowns. This foundational use of tape diagrams paves the way for more complex mathematical reasoning as students’ proficiency grows.
As students progress, tape diagrams become an excellent way to explore multiplication and division. Worksheets may ask students to represent problems like “Three times as many” or “Divided equally among” using bars divided into equal sections. This visualization helps students grasp the concept of multiplication as repeated addition or division as equal distribution, making abstract concepts tangible and easier to understand.
Fractions, Ratios, and Proportions
Tape diagrams are particularly effective for teaching fractions. Worksheets often require students to represent whole objects or sets of objects as tape diagrams divided into equal parts, and then to identify or compare parts of the whole. For example, students might need to determine what fraction of a tape diagram is shaded or compare two tape diagrams to decide which shows a larger fraction. These exercises help students internalize the notion of fractions as parts of a whole and develop skills in fraction comparison and equivalence.
In middle school, tape diagram worksheets can help students explore ratios and proportions. These might include problems where students are asked to find missing values in equivalent ratios or solve real-world problems involving proportional relationships, such as mixing ingredients in a given ratio or scaling up quantities proportionally. By drawing and analyzing tape diagrams, students can see the relationships between quantities, helping them to solve for unknowns and understand the properties of proportions.
Percentage Problems
Tape diagrams are also used in solving problems involving percentages. Worksheets may involve exercises where students use tape diagrams to calculate percentages of quantities or find the whole given a part and its percentage. These types of problems often involve real-world contexts like calculating discounts, taxes, or interest, making the math both relevant and applicable to everyday situations.
For more advanced students, tape diagrams can facilitate the understanding of algebraic expressions and equations. Worksheets may include problems where tape diagrams are used to represent unknowns and to solve equations. This method helps in visually demonstrating the balance needed in equations and can be a precursor to more formal algebraic manipulation.
Word Problems
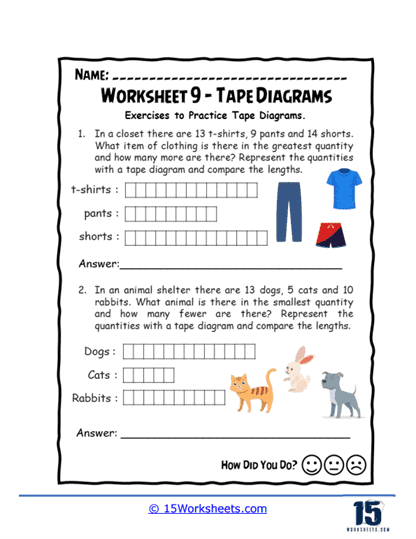
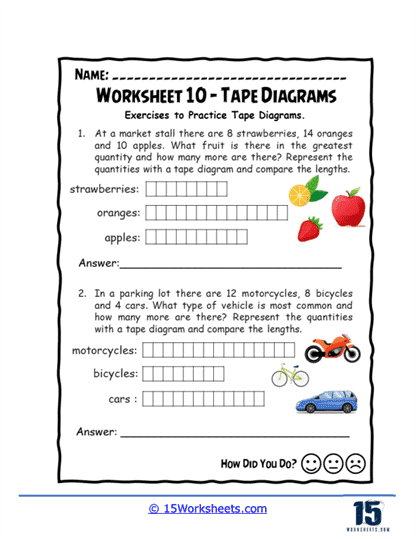
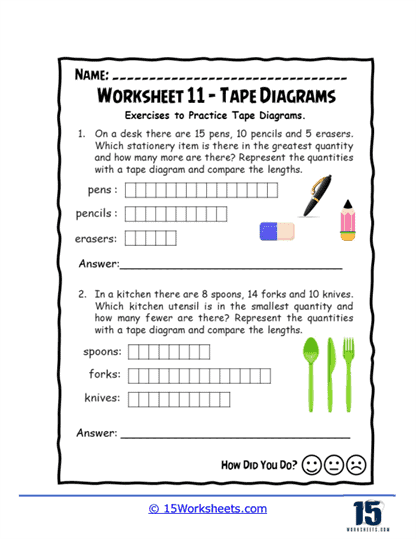
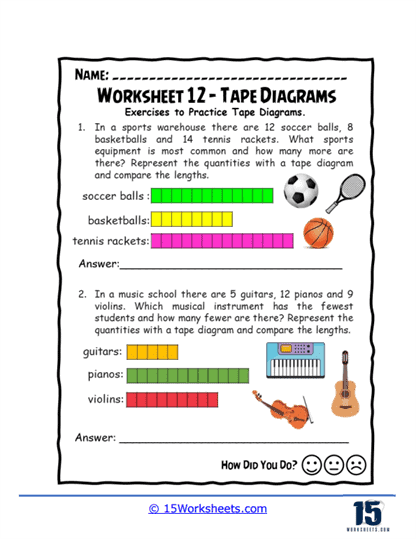
Perhaps one of the most common uses of tape diagrams in educational settings is to help students solve complex word problems. Worksheets may present scenarios involving multiple steps or operations, and students must construct and analyze tape diagrams to find solutions. This exercise not only aids in computational accuracy but also enhances students’ reading comprehension and problem-solving skills in a mathematical context.
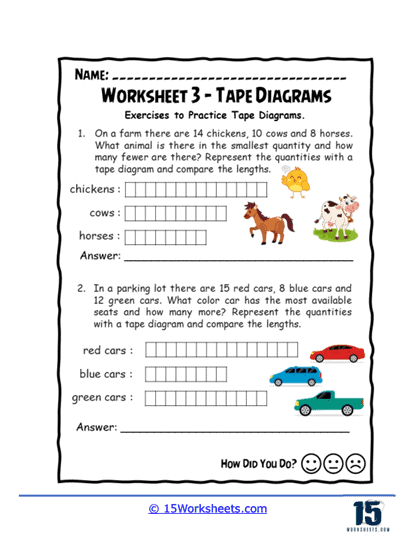
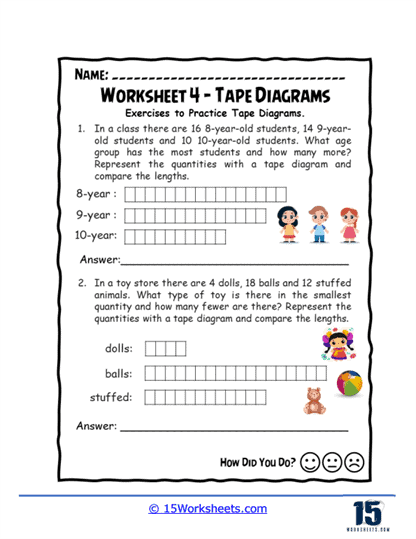
Some worksheets challenge students to use tape diagrams for comparative reasoning, such as determining which of two quantities is larger or how many times one quantity is greater than another. These types of problems often involve critical thinking and can lead to deeper insights into the nature of numbers and their relationships.
Tape diagram worksheets are a dynamic educational resource that supports a wide array of mathematical learning objectives. From simple arithmetic to complex algebraic problems, tape diagrams provide a visual strategy that enhances comprehension, fosters critical thinking, and builds problem-solving skills. These worksheets help demystify abstract concepts, making mathematics more accessible and engaging for students at all levels of proficiency.
What Are Tape Diagrams?
Tape diagrams, also known as strip diagrams, bar models, or length models, are visual tools used in mathematics education to help students understand relationships between numbers and solve problems. These diagrams represent information in a more intuitive and accessible way by using bars to visually compare different quantities. Essentially, tape diagrams are drawings that resemble segments of tape, each marked with a number or a variable to show proportions or quantities.
Tape diagrams are employed across various educational levels, primarily in the teaching of elementary and middle school mathematics. They are particularly useful for illustrating problems involving ratios, proportions, fractions, and percentages. For example, in teaching fractions, a tape diagram can visually represent the whole as a long rectangle divided into equal parts, with each part representing a fraction of the total.
This method makes it easier for students to grasp concepts like adding, subtracting, or comparing fractions, as they can see the size of the parts relative to the whole. In ratio and proportion problems, tape diagrams help students find missing values by setting up proportional relationships in a straightforward, visual manner. This can be crucial in solving real-world problems, such as adjusting a recipe or determining the correct mix of chemicals in a solution.
In addition to their use in education, tape diagrams have practical applications in various professional fields, especially those requiring the handling of data and proportions. For instance, in project management, tape diagrams can be used to represent the allocation of resources or time across different phases of a project, providing a clear overview of the distribution and facilitating easier adjustments. In finance, these diagrams can help illustrate budget allocations or the distribution of expenses and revenues, allowing for a visual representation of financial data that is easier to understand and communicate than traditional spreadsheets or reports.
Moreover, tape diagrams are valuable in the design and manufacturing industries where proportions and measurements are crucial. For example, designers can use tape diagrams to map out space usage in product design or in planning the layout of a room or a building. By providing a visual method to manipulate and experiment with space, proportions, and relationships, tape diagrams aid in creating more efficient designs and better use of materials.