Tape Trials
Worksheet Description
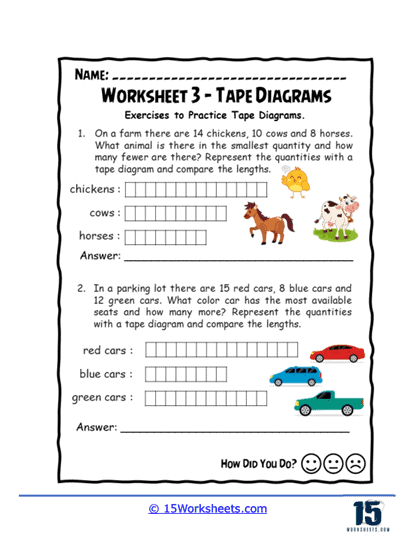
The worksheet is a thoughtfully crafted worksheet that introduces students to the concept of quantity comparison using tape diagrams in engaging and familiar settings. The first task involves counting animals on a farm, specifically chickens, cows, and horses, and determining which group has the fewest animals. The second task shifts to a bustling parking lot, where students are asked to compare the number of red, blue, and green cars to identify which color is most prevalent. These scenarios are designed to help students visualize numerical data and understand differences in quantities through the use of tape diagrams.
This worksheet aims to teach students how to effectively use tape diagrams to represent and analyze quantities in a clear, visual manner. By engaging with contexts such as farm animals and car counts, students practice basic counting and comparison skills, which are fundamental in developing mathematical reasoning. The tasks also enhance students’ abilities to identify lesser and greater quantities, fostering critical thinking skills that are applicable in everyday decision making. Furthermore, by translating abstract numbers into concrete visual representations, students learn to organize and interpret data, preparing them for more complex mathematical concepts in the future.