Desk and Dine
Worksheet Description
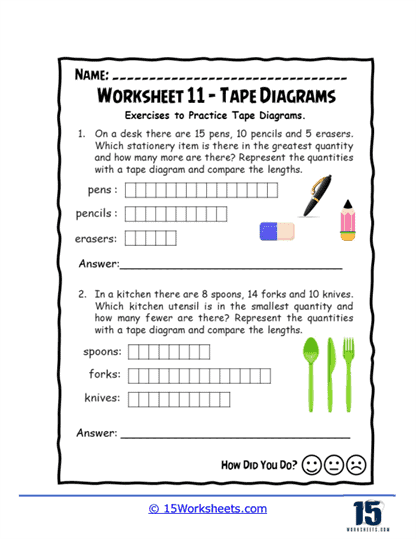
The worksheet is an engaging worksheet that combines the settings of a school desk and a kitchen to practice using tape diagrams for comparing quantities. In the first task, students examine an assortment of stationery items-pens, pencils, and erasers-to determine which item is most abundant and by how much. The second task shifts to kitchen utensils, where spoons, forks, and knives are compared to identify the item in the least quantity. Each scenario challenges students to use tape diagrams to visually represent and compare the numbers, making abstract quantities tangible and easier to understand.
Educational Goals of the Worksheet:
This worksheet teaches students how to utilize tape diagrams effectively to compare and visualize numerical data. Through the tasks, students learn to identify which items are most and least common in a set and calculate the difference in quantities between them. The use of everyday objects like stationery and kitchen utensils makes the activity relatable and reinforces practical math skills in real-world contexts. Additionally, these exercises aim to enhance students’ problem-solving abilities and improve their understanding of graphical data representation, fostering a deeper comprehension of basic arithmetic and data interpretation.