Diagram Decisions
Worksheet Description
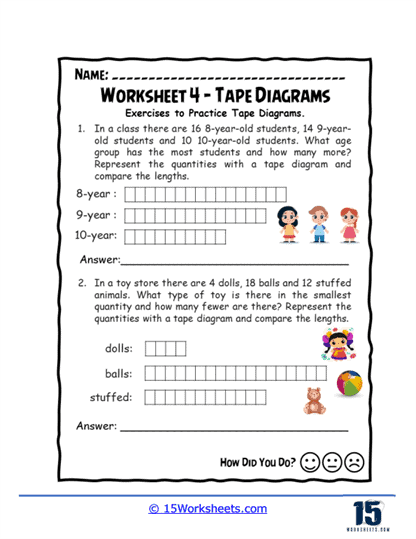
The worksheet creatively uses tape diagrams to explore comparative quantities in educational and retail settings. The first exercise tasks students with examining the number of 8-year-olds, 9-year-olds, and 10-year-olds in a class to identify which age group has the most students. The second scenario takes students to a toy store where they must determine which type of toy-dolls, balls, or stuffed animals-is in the smallest quantity by comparing their numbers. Each situation prompts students to use tape diagrams to visualize these quantities, enabling a straightforward comparative analysis.
This worksheet is designed to enhance students’ ability to use tape diagrams for effectively representing and comparing quantities. By engaging students with relatable scenarios such as class sizes and toy assortments, the worksheet encourages practical application of mathematical concepts. The tasks improve students’ skills in identifying and quantifying differences and similarities, critical for developing mathematical reasoning and problem-solving abilities. Moreover, these exercises foster a deeper understanding of visual data representation, helping students grasp abstract concepts through concrete, visual formats.