Diagramming Differences
Worksheet Description
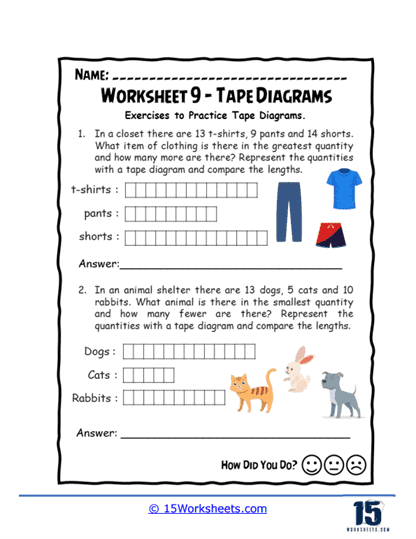
The worksheet combines everyday scenarios-a closet inventory and an animal shelter count-to practice tape diagrams. The first task has students assess a collection of t-shirts, pants, and shorts to determine which clothing item is most numerous, using tape diagrams to compare their quantities visually. The second task transitions to an animal shelter, where students must compare the numbers of dogs, cats, and rabbits to identify the animal in the smallest quantity. These practical applications help bridge mathematical concepts with real-world contexts, making learning both engaging and relevant.
This worksheet aims to enhance students’ skills in using tape diagrams to visualize and compare different quantities effectively. By requiring students to represent numerical data visually, it fosters a deeper understanding of proportions and relationships between groups. The worksheet also encourages students to apply basic arithmetic operations to find differences and similarities among the data presented. Overall, it builds critical thinking and problem-solving skills, as students analyze and interpret visual information to answer practical questions about clothing and animals in familiar settings.