Tape Diagram Tactics
Worksheet Description
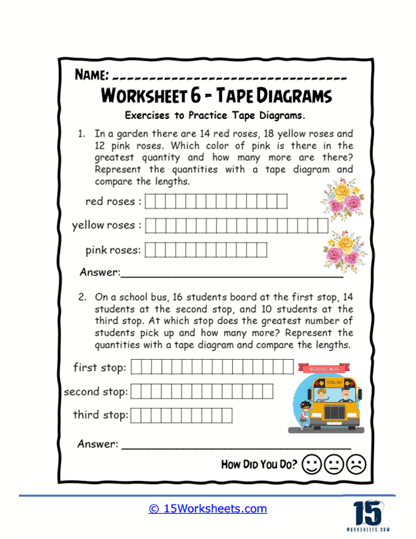
The worksheet is a dynamic worksheet that uses tape diagrams to teach students about comparing quantities in two distinct scenarios – a garden and a school bus route. In the garden scenario, students compare the number of red, yellow, and pink roses to determine which color is most prevalent. In the bus route scenario, they analyze the number of students boarding at three different stops, identifying which stop has the most boardings. Each scenario requires the use of tape diagrams to visually organize and compare the quantities, making abstract numbers more accessible and understandable.
This worksheet is aimed at improving students’ ability to use tape diagrams to visually represent and compare numerical data effectively. By engaging with real-world examples such as counting flowers and tracking bus ridership, students learn to apply mathematical concepts in varied contexts. The tasks encourage students to develop skills in observation, counting, and critical thinking as they analyze which quantities are greater or lesser. Additionally, the exercises promote an understanding of basic math operations, including addition and subtraction, through practical application and visual data interpretation.