Venn Diagrams Worksheets


About These 15 Worksheets
These worksheets are versatile tools that bridge the gap between abstract set theory and visual comprehension. They allow students to understand, visualize, and interact with mathematical relationships in a tangible way. By progressing through the exercises, from simple two-set problems to more intricate multi-set challenges, students develop a deeper understanding of how sets relate to each other and the broader world of mathematical logic.
Venn diagrams, named after British logician John Venn in the 19th century, are illustrations used in the branch of mathematics called set theory. They show the mathematical or logical relationship between different groups (sets) of things. These diagrams consist of overlapping circles, with each circle representing a specific group or set. The overlapping parts of the circles show commonalities between the sets.
These math Venn Diagram worksheets were designed to help students understand and practice using Venn diagrams in various mathematical contexts. The worksheets can be invaluable in teaching students about sets, their relationships, and how to visualize and understand complex multi-set problems.
Types of Exercises on These Worksheets
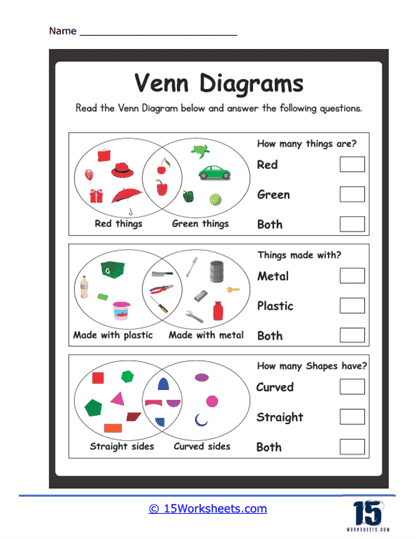
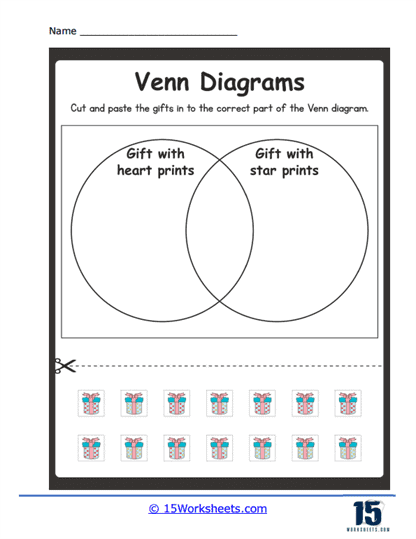
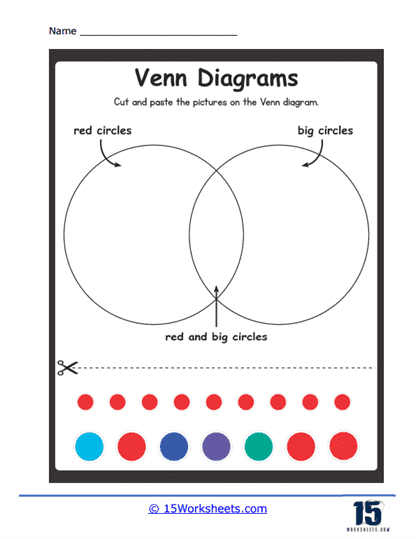
Identifying Set Elements – Here, students are asked to identify the elements of a set based on a Venn diagram.
Exercise: Given a Venn diagram with the circles labeled “Fruits” and “Red”, and the overlapping section containing “Apple”, identify which section a “Banana” would belong to.
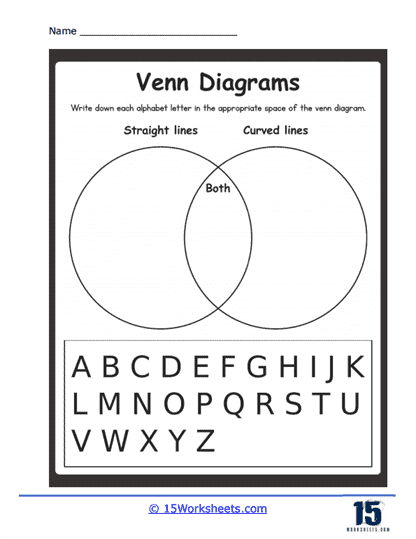
Comparing Two Sets – Students use a Venn diagram to compare two sets and identify similarities and differences.
Exercise: Use a Venn diagram to compare and contrast “Squares” and “Rectangles”. The overlapping section would contain attributes like “Four sides”, while unique sections would contain “All sides equal” (for Squares) and “Opposite sides equal” (for Rectangles).
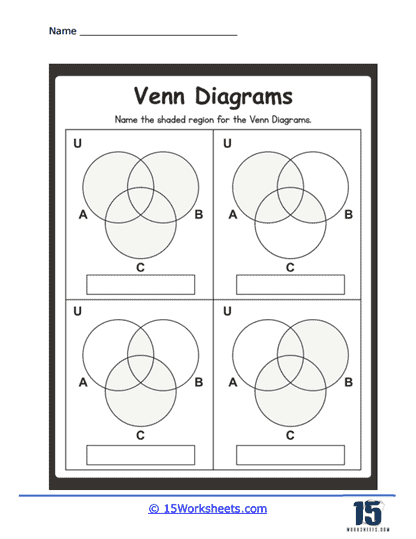
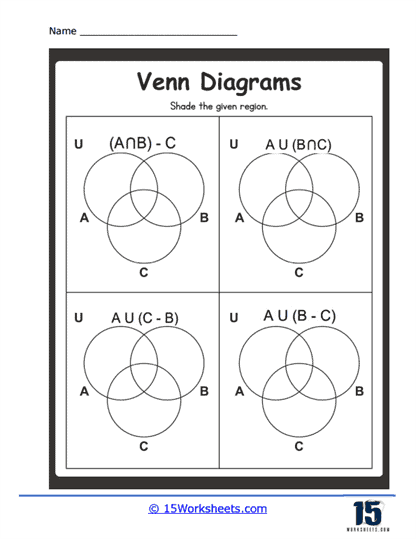
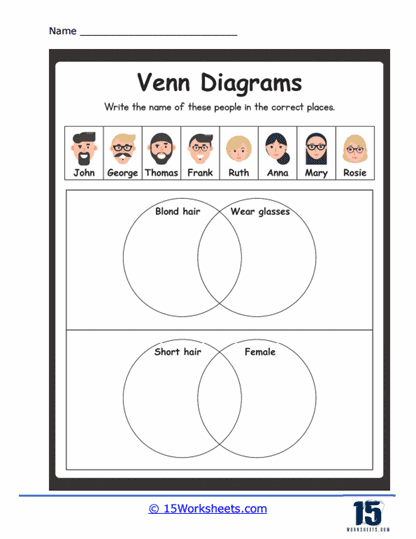
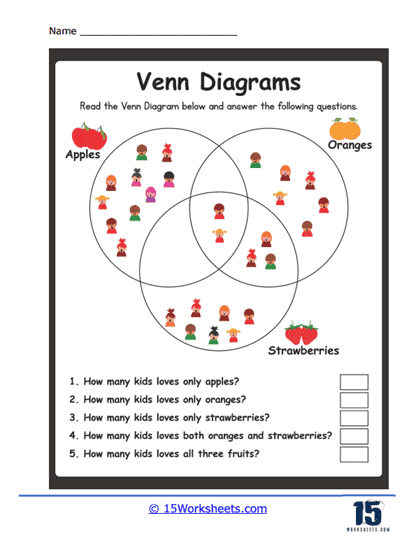
Three-Set Venn Diagrams – These exercises involve diagrams with three overlapping circles, helping students visualize the relationships between three distinct sets.
Exercise: Given circles labeled “Musicians”, “Actors”, and “Athletes”, students might be asked to place various celebrities in the appropriate sections based on their professions.
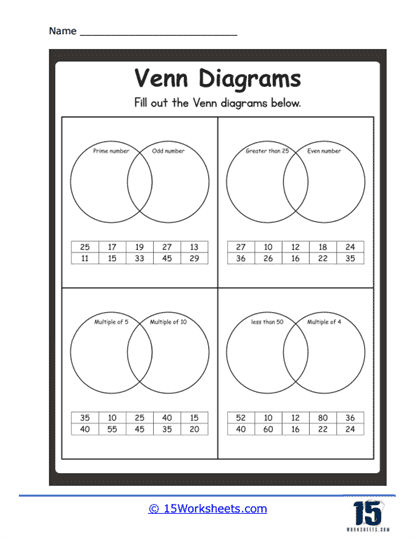
Higher Number Set Venn Diagrams – For more advanced students, Venn diagrams can be expanded to include more than three sets, though these can become increasingly complex.
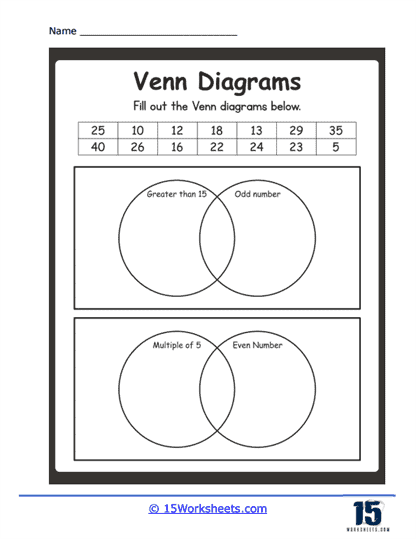
Exercise: Create a Venn diagram comparing “Prime numbers”, “Even numbers”, and “Numbers less than 10”.
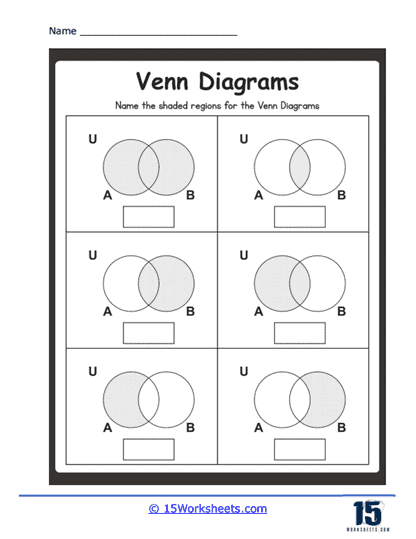
Shading Regions – Exercises where students are asked to shade specific regions of a Venn diagram based on given criteria.
Exercise: Shade the region of a Venn diagram where “Birds” and “Can Fly” overlap, excluding “Penguins”.
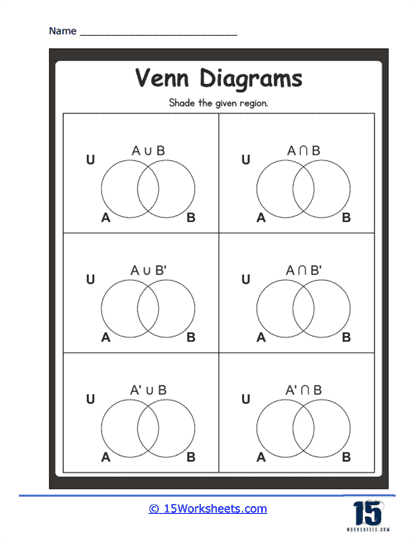
Union, Intersection, and Complement – Teaching students the concepts of union (combination of sets), intersection (common elements of sets), and complement (elements not in the set).
Exercise: Given sets A and B on a Venn diagram, identify the regions that represent A union B, A intersect B, and the complement of A.
Set Notations and Venn Diagrams – Exercises designed to teach students how to translate between set notation (like A U B for union) and Venn diagrams.
Exercise: Represent the set notation A U B on a Venn diagram.
When Are These Used In The Real World?
Venn diagrams, while rooted in mathematical theory, are versatile tools with broad applications beyond academia. In the realm of business, these diagrams are invaluable for assessing market overlaps, understanding target audiences, and comparing product features. The decision-making process becomes clearer when potential overlaps and intersections are visually represented.
In the world of science and medicine, Venn diagrams have distinct roles. Biologists employ them to denote relationships in ecological studies, such as the overlap of species in various habitats. Furthermore, in genetics, they illuminate commonalities among different gene sets. In the medical field, these diagrams can effectively illustrate the intersection between symptoms of multiple diseases or the impacts of various treatments.
The fields of computer science and data analysis are no strangers to Venn diagrams either. Database queries often involve filtering data based on multiple criteria, making these diagrams a practical choice. They’re also handy in logic design. Additionally, in statistics, researchers use Venn diagrams to visually decipher the overlap between data sets, assisting in recognizing correlations or inconsistencies.
Marketing, advertising, and even project management fields frequently use Venn diagrams. Whether it’s understanding target demographics in marketing or viewing the overlap between team members’ skills in project management, Venn diagrams bring clarity. In design, particularly UX and UI, the diagrams can be pivotal in understanding the intersections of user needs, behaviors, and preferences.
Venn diagrams find their way into daily personal decisions and brainstorming sessions. Individuals might utilize them, even unconsciously, to choose a mutually preferred restaurant or to find common ground in team discussions. Even in political, social, and environmental discussions, these diagrams are instrumental in representing shared values or interests, facilitating meaningful dialogue and understanding.