100s Chart Worksheets
What Are 100s Chart?
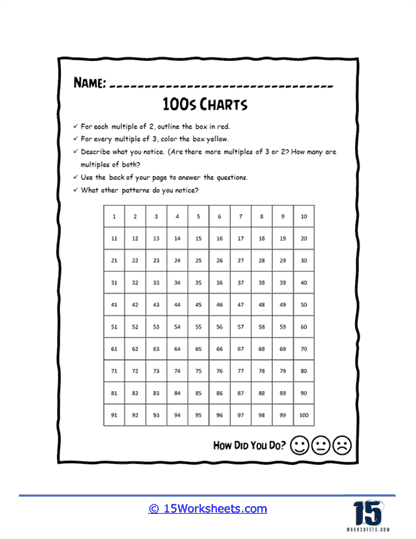
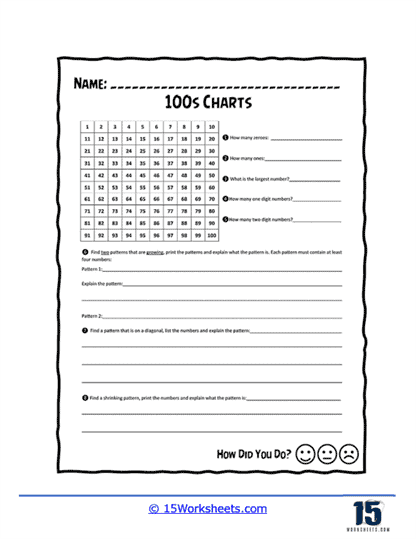
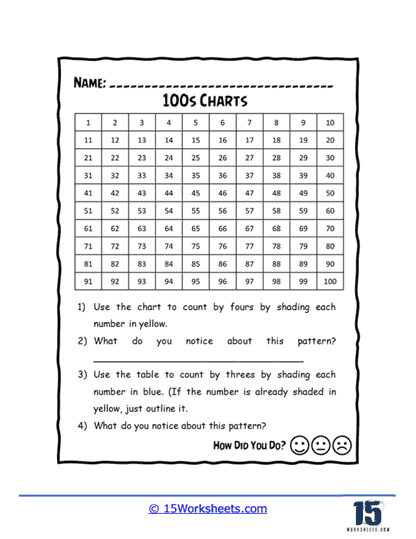
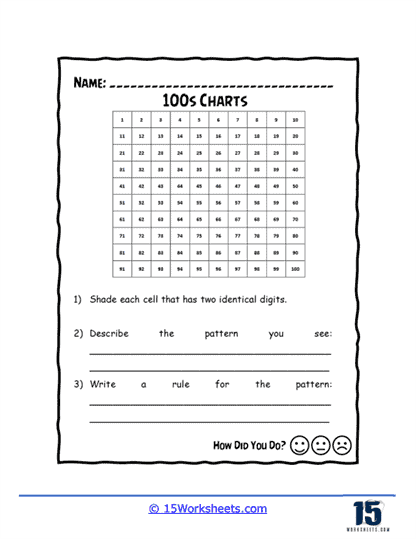
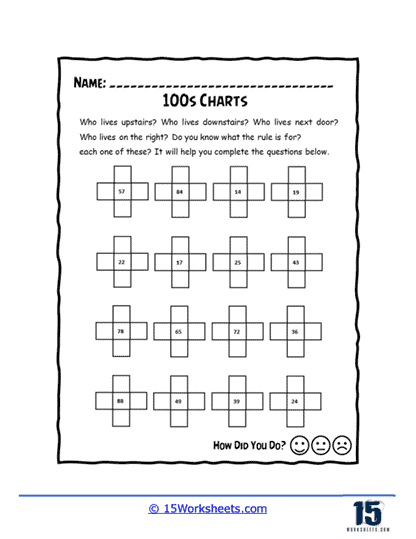
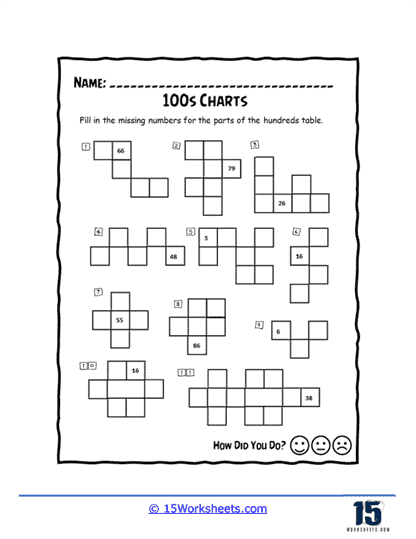
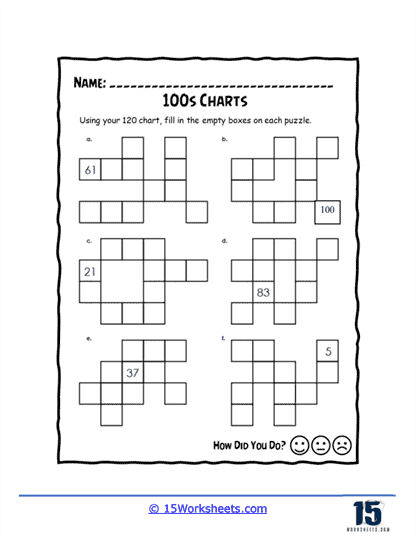
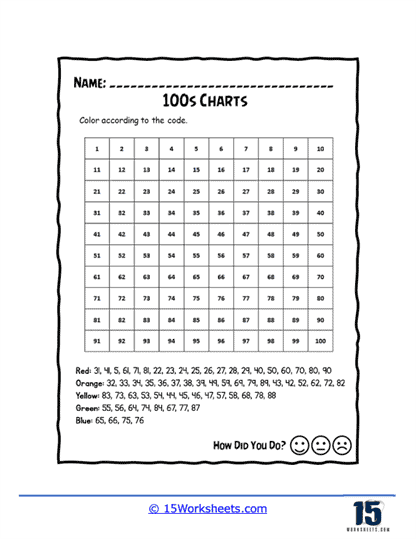
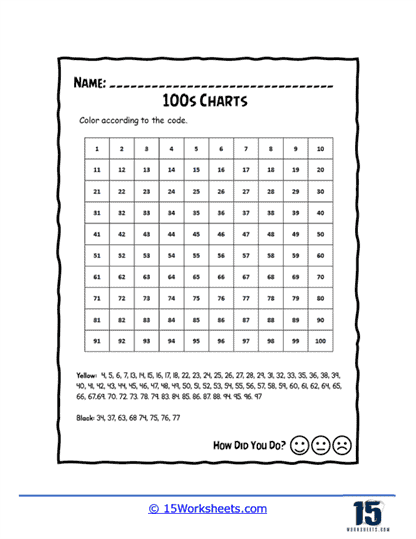
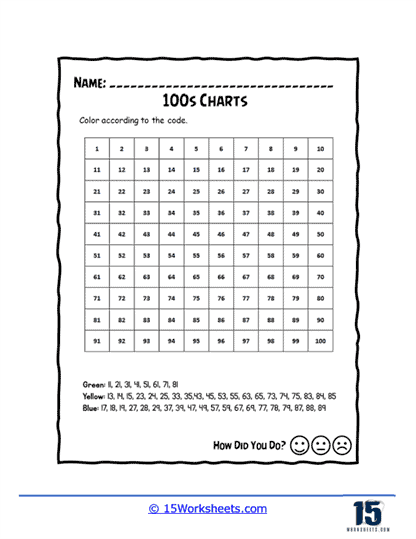
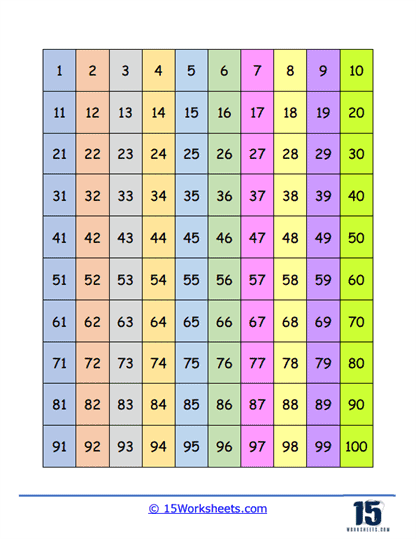
A 100s chart, also known as a hundred chart or 100-chart, is a visual representation of the numbers from 1 to 100, typically arranged in a 10×10 grid. Each cell in the grid contains a consecutive number, starting with 1 in the top-left corner and ending with 100 in the bottom-right corner. The numbers increase from left to right in each row, and then from top to bottom.
100s charts are helpful in various ways, particularly for students who are learning basic math concepts. Some of the benefits include:
Number Recognition – 100s charts help students recognize and become familiar with numbers from 1 to 100. This forms a foundation for learning more complex math concepts.
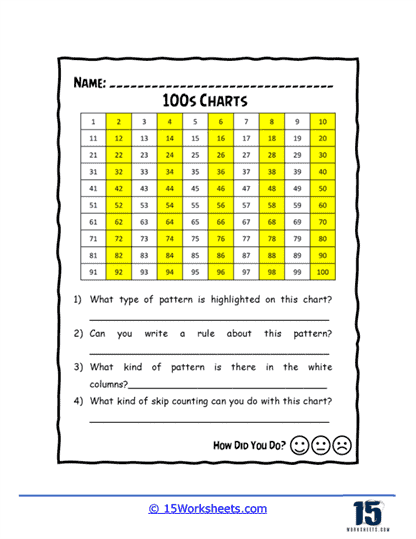
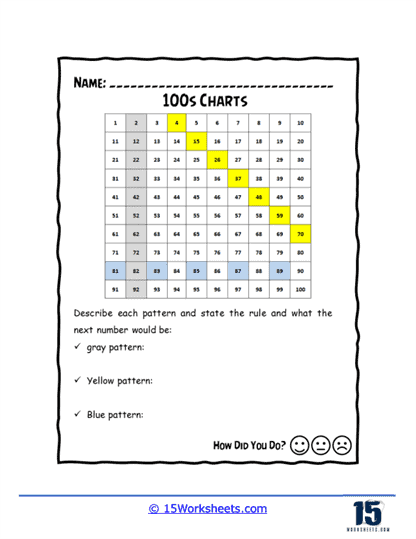
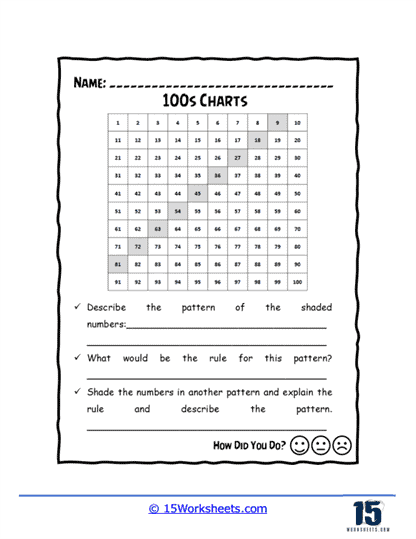
Understanding Patterns – Students can observe and identify patterns in the number sequences, such as odd and even numbers, multiples of specific numbers, or patterns formed by skip counting.
Addition and Subtraction – 100s charts can serve as a visual aid for basic addition and subtraction problems. Students can use the chart to count forward or backward to find the sum or difference of two numbers.
Skip Counting – 100s charts are useful for teaching skip counting, which is counting by a particular number (e.g., counting by 2s, 5s, or 10s). Skip counting is an important skill that helps students develop their multiplication and division abilities.
Place Value – Students can use 100s charts to understand the concept of tens and ones and how numbers are composed of these place values.
Developing Number Sense – 100s charts help students develop a sense of the relative sizes of numbers and their relationships to one another.
Problem-solving – Teachers can use 100s charts to create puzzles or challenges, encouraging students to use their number sense and problem-solving skills.
Overall, 100s charts are valuable tools for teaching and reinforcing fundamental math skills, as they provide a visual and tactile way for students to interact with numbers and develop their understanding of basic arithmetic concepts.

