Colored 100s Columns Chart
Worksheet Description
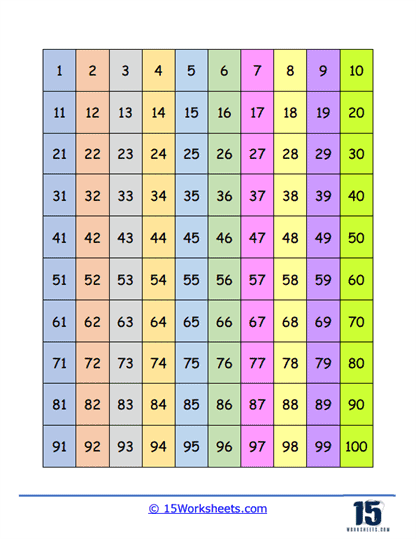
This worksheet displays a 100s chart, which is a grid containing the numbers from 1 to 100. Each row of the chart is highlighted in a different color, creating a rainbow effect across the chart. The colors change with each row, providing a clear visual distinction between the sequences of ten. This colorful presentation of the numbers is not only appealing but also serves as a visual aid to help distinguish the rows from one another.
The worksheet is designed to teach students about number sequences and patterns within a 100s chart. The color differentiation between rows helps students quickly identify and differentiate between the tens, aiding in the understanding of place value and the base-ten number system. The visual separation of the numbers can also assist students in learning to count by tens, a foundational skill in mathematics. Additionally, the colorful format can make the learning process more engaging and may assist in memory retention of the numerical order.