Subtraction Charts and Tables Worksheets


About These 15 Worksheets
Subtraction charts and tables are like little roadmaps for math facts. Instead of guessing or counting on fingers every single time, students can use patterns and organized grids to spot subtraction answers much faster. These worksheets help kids build confidence with subtraction facts by letting them see how numbers connect and change. Some pages are fully completed as helpful references, while others leave blank spaces for students to solve on their own. It’s a calm, structured way to make subtraction feel less stressful and much more manageable.
This collection includes all kinds of subtraction chart styles so students can practice in different ways without getting bored. Some worksheets focus on filling in missing answers, while others use themed tables with robots, cupcakes, animals, or Halloween decorations to make practice feel more playful. Students also get opportunities to notice patterns in subtraction, which is a huge step toward stronger mental math skills later on. The organized layouts encourage careful thinking and help learners become more independent while solving problems. It’s basically subtraction practice with a built-in math helper sitting right on the page.
Subtraction charts are especially useful because they help students move from counting slowly to recognizing subtraction facts automatically. Over time, kids begin spotting patterns and relationships between numbers without needing to stop and solve every problem from scratch. These worksheets strengthen number sense, mental arithmetic, and overall math confidence in a very visual way. They also work wonderfully for review days, homework help, math centers, or quick practice sessions at home. And honestly, subtraction feels a lot friendlier when there are robots, spiders, cupcakes, and dogs hanging around the worksheet.
About Each Worksheet
Spider Subtract Chart
This subtraction chart spins a giant web of subtraction facts for students to explore. Kids follow the rows and columns to figure out differences between numbers while spotting patterns all across the chart. The organized layout helps subtraction feel more predictable instead of random and confusing. Some students even start noticing shortcuts after filling in enough boxes. Plus, any worksheet with spiders automatically feels a little more adventurous.
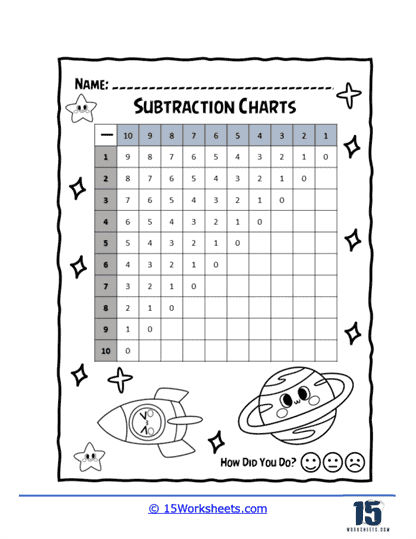
Back of the Stars
This chart gives students a few completed answers first, almost like tiny subtraction clues to get them started. From there, kids fill in the rest of the boxes by carefully subtracting numbers across the grid. The partially completed setup helps nervous learners feel supported instead of staring at a totally blank page. It’s a nice mix of guided practice and independent thinking. Think of it like subtraction with training wheels still attached.
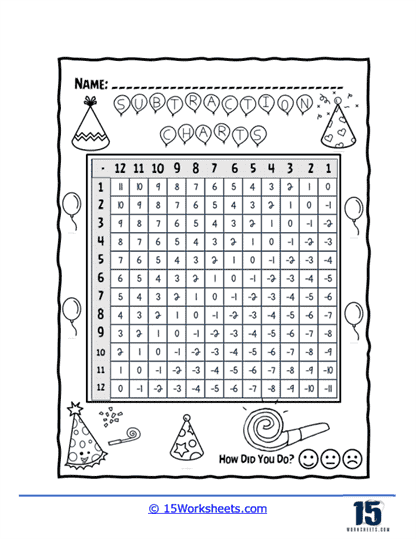
Birthday Chart
This worksheet feels a little like a subtraction birthday party chart. Everything is already filled in, so students can use it as a quick-reference guide while learning subtraction facts from 1 to 12. Some kids study the chart like a secret code book while others use it to double-check their work during practice. The patterns become easier to recognize the longer students stare at the rows and columns. It’s basically a subtraction cheat sheet in the best possible way.
Subtract Columns
Here students focus on one subtraction number at a time, which makes the facts feel much easier to organize mentally. Each column groups subtraction equations together so learners can notice how the answers change in predictable ways. It’s especially helpful for students who feel overwhelmed by giant mixed-problem worksheets. The setup almost feels like practicing subtraction facts in little organized neighborhoods. Once the patterns click, the math gets much faster.
Empty Cupcakes
Cupcakes and subtraction are honestly a pretty strong combination. Students fill in the missing answers on the subtraction chart while using the completed boxes as little hints along the way. The partially filled chart gives kids confidence because they don’t feel like they’re solving everything alone. It also helps learners spot number patterns without even realizing they’re doing deeper math thinking. Somehow subtraction feels less stressful when cupcakes are involved.
Show the Equations
This worksheet acts like a giant subtraction fact library. Students can use the tables to study subtraction facts, cover answers for practice, or test themselves one section at a time. Focusing on one subtrahend at a time helps kids stop feeling overwhelmed by too many facts all at once. Some students end up memorizing patterns without even trying because they see the equations repeatedly in organized groups. It’s like having a subtraction encyclopedia right on the desk.
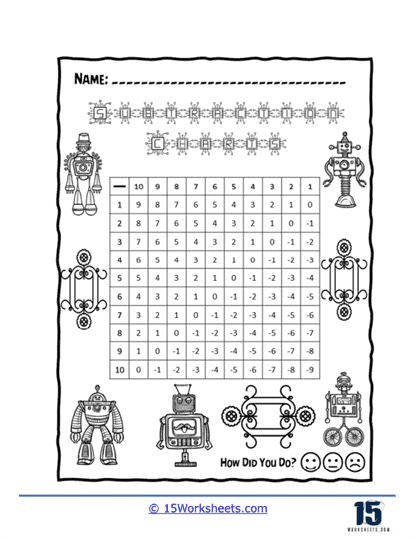
Robots 10s
These goofy little robots are here to make subtraction charts feel less serious. Students use the completed chart to study subtraction facts and notice how the numbers change across rows and columns. The robot theme adds just enough silliness to keep younger learners interested while practicing important math skills. Some kids even start racing themselves to find answers faster after studying the patterns for a while. Apparently robots are surprisingly good at subtraction.
Reverse 1-12
This chart flips subtraction facts into a neat organized grid where students can quickly track differences between numbers. The fully completed setup works well for learners who need a reliable reference while building confidence with subtraction facts. Kids often start noticing how subtraction patterns repeat themselves across different rows. The more they explore the chart, the more subtraction starts making logical sense instead of feeling random. It’s basically pattern hunting disguised as math practice.
Negative Values Chart
Desserts everywhere and subtraction facts everywhere – honestly, not a bad setup. Students use this sweet-themed subtraction chart to practice finding differences while studying the patterns inside the grid. The completed chart makes it easier for kids to check their thinking and build faster recall over time. The colorful dessert decorations help the page feel more welcoming for reluctant math learners. Math with cupcakes and candy tends to go over pretty well.
Entry Chart
This worksheet organizes subtraction tables by the number being subtracted, which helps students focus on one math pattern at a time. Kids work through subtraction facts while spotting how answers shift depending on the starting number. The animal icons at the top make the page feel playful instead of overly academic. Some students naturally begin memorizing facts after seeing the repeated patterns enough times. It’s kind of like subtraction practice mixed with a mini zoo visit.
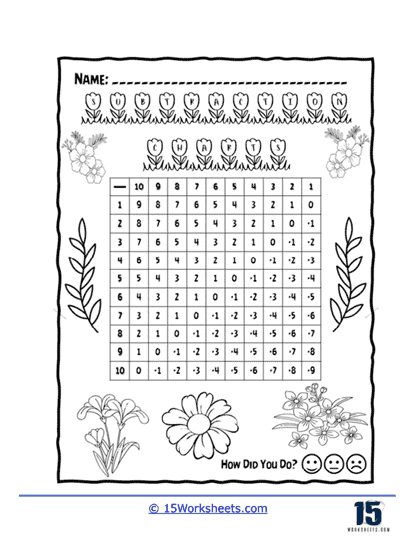
Reverse 10 Subtracts
This page turns subtraction into a giant counting-down pattern adventure. Students follow rows of numbers decreasing step by step, helping them understand subtraction as numbers getting smaller in sequence. The repeated patterns make it easier for young learners to predict what comes next without relying completely on counting. The flowers and decorations keep the worksheet feeling cheerful instead of plain. It’s subtraction practice with strong garden vibes.
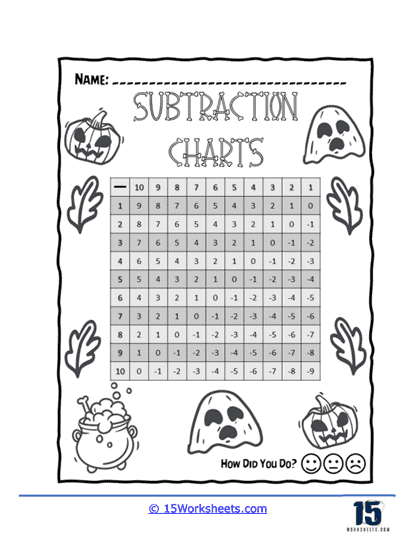
Halloween Subtract Chart
Pumpkins, ghosts, and subtraction all show up together on this spooky little chart. Students follow the descending number patterns while strengthening subtraction skills in a festive way. The Halloween theme keeps kids interested while they quietly practice number relationships and counting backward. Some learners end up more focused because the decorations make the worksheet feel like a seasonal activity instead of regular math work. Honestly, subtraction feels a little cooler around Halloween.
Front and Back
This worksheet uses simple decreasing number patterns to help students build subtraction fluency step by step. The cat and owl decorations add personality while learners follow the sequences from larger numbers down to smaller ones. Kids start recognizing how subtraction creates predictable changes across rows and columns. The repeated structure builds confidence because students quickly realize they know what should come next. It’s calm, organized subtraction practice without unnecessary distractions.
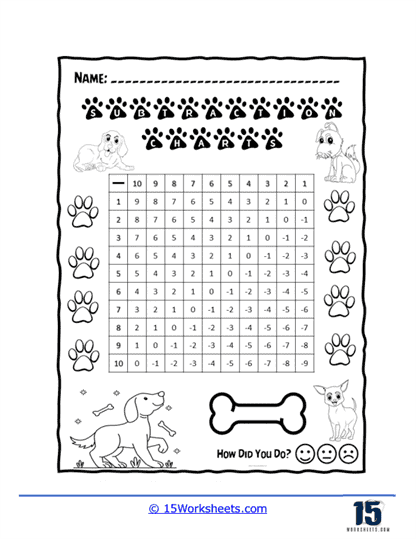
Positive and Negative
Dog lovers are probably going to enjoy this one immediately. Students practice subtraction within 10 by following number patterns that steadily decrease across the page. The repeated sequences help young learners strengthen mental subtraction skills without needing lots of separate equations. The playful dog illustrations keep the worksheet feeling light and approachable for students who sometimes get nervous about math. Turns out subtraction works better with puppies nearby.
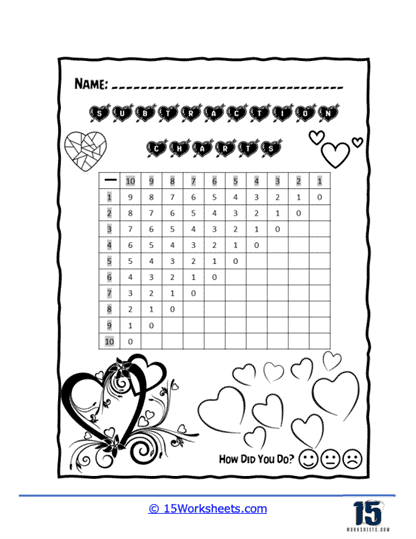
Fill in the Bottom
This worksheet asks students to finish the subtraction patterns themselves instead of simply reading completed charts. The blank spaces encourage learners to think carefully about what number should come next in the sequence. Kids practice subtraction while also building confidence with pattern recognition and independent thinking. The heart-themed decorations make the activity feel warm and inviting instead of overly serious. It’s a nice reminder that even subtraction worksheets can have a little personality.