Addition Charts Worksheets


About These 15 Worksheets
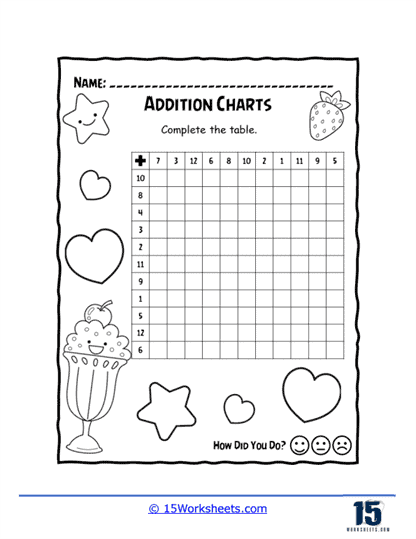
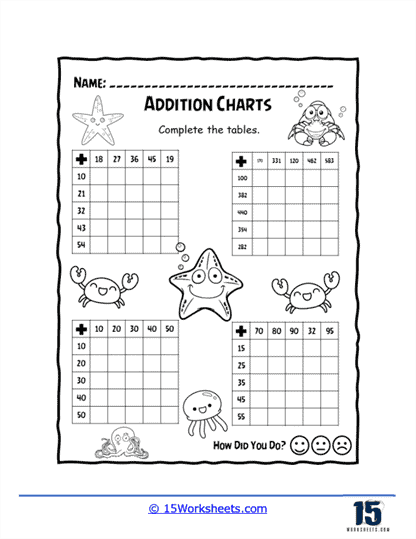
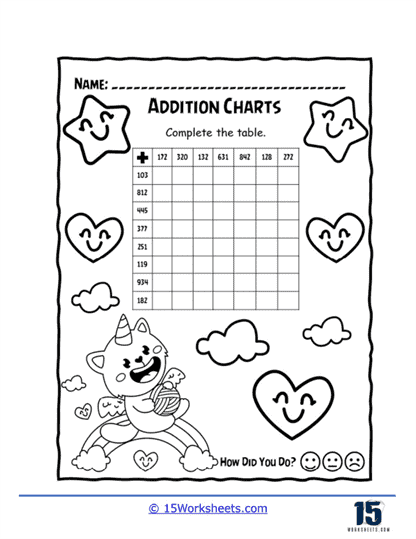
An addition chart tables display a grid with numbers 0-9 (or higher, depending on the level of the students) listed down the side (rows) and across the top (columns). At each point where a row and column meet, you would find the sum of the number listed in the column and row. These are tools that can help children understand and memorize basic addition facts quicker and in an engaging manner.
The purpose of the chart is to provide a visual aid that children can use to determine the sum of two numbers. To use the chart, a child would find one addend on the top row and the other addend on the side column. Where these two lines intersect in the grid, the child will find the sum of those two numbers.
How to Use These Charts With Students
Remember, every student learns at their own pace, so it’s important to be patient and provide plenty of practice opportunities. The goal is to build understanding and confidence, which will lay the foundation for more complex math skills in the future. Teaching addition using addition tables can be done effectively through several stages, each building on the understanding developed in the previous stage.
First, introduce the addition chart to the students. Explain how it is organized with one addend listed across the top and the other down the side. Discuss how to find the sum of two numbers by finding where the row and column of those numbers intersect. Show several examples. For instance, if you want to find 3 + 2, find the number 3 on the top row and number 2 on the side column. Where these two intersect, that’s your answer: 5. Have the students try a few problems with your guidance. For instance, you might ask, “What is 4 + 2?” and guide them as they find the answer on the chart.
Once students are comfortable with using the addition table, begin discussing patterns they might see. For example, the numbers in the table increase by 1 each time you move down a row or across a column. They may also notice that the numbers along each diagonal are the same (e.g., 1+0, 2+1, 3+2, etc.). This can help them understand the commutative property of addition (e.g., 2+3 is the same as 3+2).
Once students are familiar with the chart and can use it well, incorporate games that improve speed and help in memorizing the sums. For example, time how fast they can find sums on the chart, or play ‘Bingo’ with addition problems where they have to find the answer on the chart.