Percentage of Error Worksheets


About These 15 Worksheets
Let’s be honest-nobody gets estimates perfect all the time. That’s where percentage of error comes in, and this collection of worksheets gives students the tools to measure just how far off an estimate or prediction really is. By comparing actual results with estimated values, learners practice a simple but powerful formula that connects subtraction, division, and percentages. The result? Students stop fearing mistakes and start seeing them as learning opportunities.
Each worksheet in this set takes a slightly different spin: some focus on quick calculations, others on real-world scenarios like attendance numbers or weather forecasts. A few even encourage deeper thinking about why the errors exist. This variety keeps students engaged while reinforcing the math skills they’ll use in both academics and daily life. With repetition across fun formats, learners build fluency and accuracy without getting bored.
The beauty of practicing percentage of error is that it blends math with critical thinking. Students don’t just solve problems-they analyze results, question accuracy, and learn to check assumptions. These worksheets lay the groundwork for higher-level skills in science labs, data analysis, and real-world decision making. By the time they finish the set, students won’t just know how to calculate error-they’ll appreciate why it matters.
Have a Look Inside Each Worksheet
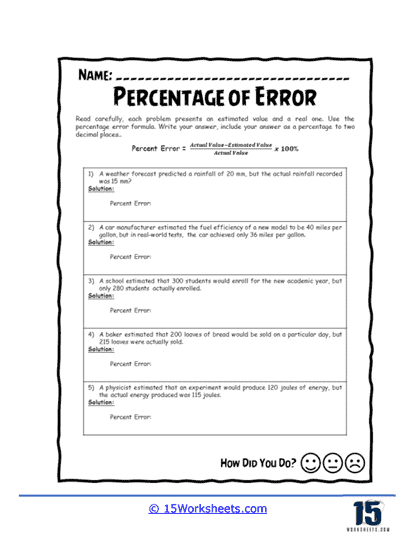
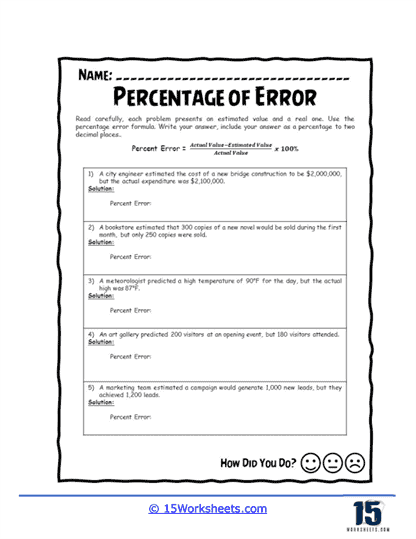
Forecast Flaws
Students compare forecasted numbers with actual outcomes and calculate the percentage of error. This helps them see how predictions can be off in real-world scenarios like weather or sales. The activity strengthens skills in subtraction, division, and rounding. It makes accuracy in estimates a concrete concept.
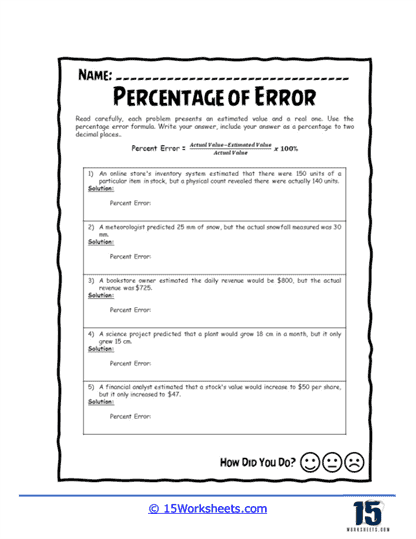
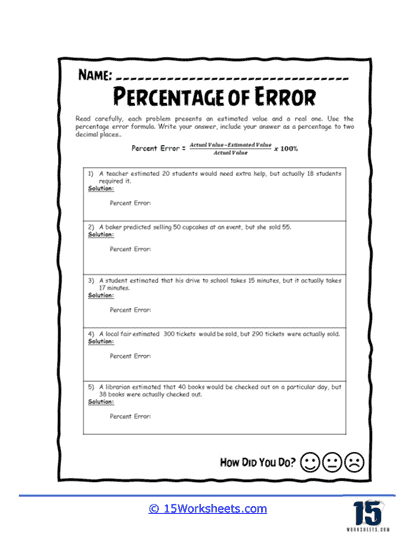
Estimate Accuracy
Learners work on problems that test how close an estimate is to the true value. They calculate error as a percentage to measure accuracy. This worksheet focuses on precision and neat calculations. A good fit for students who are building confidence with estimates.
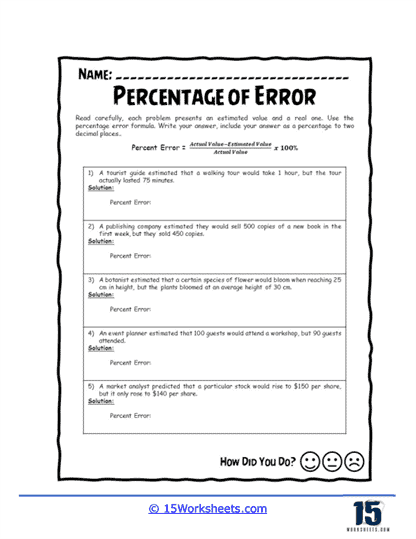
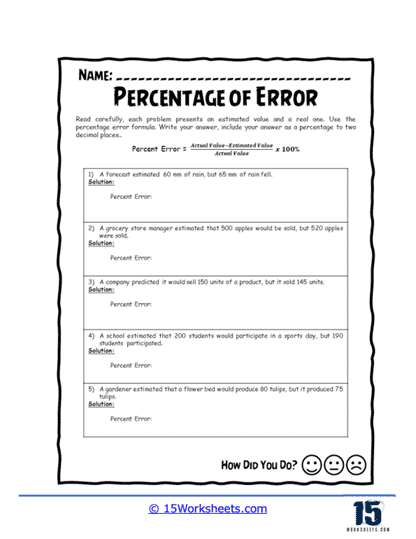
Estimate Check
Here, students check estimates against real results and quantify the difference. It reinforces the formula for percentage error step by step. The activity also builds logical problem-solving skills. Great for practice in applying math to everyday situations.
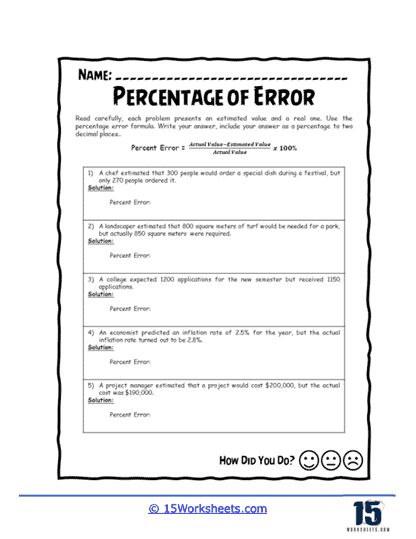
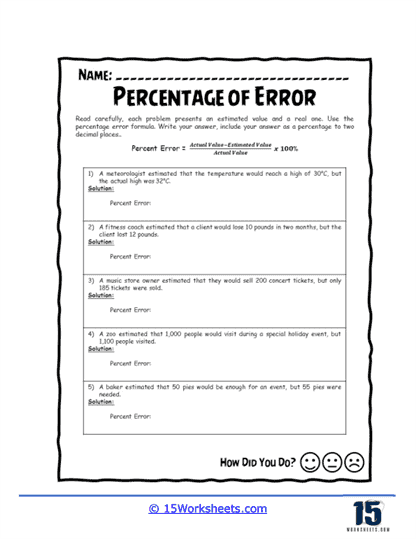
Accuracy Check
Students focus on analyzing the reliability of different values. The worksheet encourages careful attention to detail and clear computation. It supports critical thinking about when estimates are “good enough.” Perfect for bridging classroom math to real applications.
Estimation Gaps
This activity highlights the “gap” between predicted and actual values. Learners measure that difference in percentage form. It builds awareness of how even small number differences can matter. A simple but powerful way to see precision in action.
Estimation Challenges
Students tackle slightly trickier problems involving prediction versus reality. The worksheet encourages persistence and accuracy in multi-step problems. It sharpens both math fluency and real-world reasoning. A solid challenge for growing learners.
Estimate Discrepancies
Here, students calculate the error caused by discrepancies between estimates and actuals. They work on converting those differences into percentages. This helps them understand how outcomes can deviate in business, science, or daily life. A strong tool for applied math skills.
Reality Check
This worksheet asks students to test how realistic estimates are by running the error formula. It reinforces the idea that numbers should be questioned and checked. Students get practice in verifying outcomes instead of accepting them at face value. A great worksheet for building critical thinkers.
Estimate Insights
Students calculate errors but also reflect on why those errors might exist. The activity connects math to reasoning and real-world variables. It turns simple calculations into lessons in analysis. Excellent for deeper understanding of percentage error.
Estimation Accuracy
This worksheet centers on calculating how precise or imprecise an estimate is. Students practice rounding results to two decimal places. It builds both math accuracy and presentation of answers. Good for strengthening neatness in problem-solving.
Estimate Errors
Students identify mistakes in estimates and measure them through percentage error. This makes math feel like detective work-spotting the problem and fixing it. It sharpens observational skills alongside calculation. Fun and practical for learners.
Prediction Gaps
Students work with scenarios involving predictions, then compute how far off they were. The emphasis is on the gap between expectations and results. It ties into critical thinking about forecasting and accuracy. Very useful for connecting math to future planning.
Forecast Failures
Learners calculate percentage error when predictions don’t match outcomes at all. It’s a lesson in humility and precision rolled into one. Students learn that math helps measure where things went wrong. A lively way to show the value of calculation.
Event Estimations
This worksheet uses event-based problems (like attendance numbers) to teach error calculation. Students practice applying the formula in realistic contexts. It’s practical and relatable for school or community settings. Great for making math feel useful.
Estimation Errors
Students wrap up by calculating percentage errors across multiple types of scenarios. It’s a general review of all the core skills. The worksheet reinforces accuracy, rounding, and applying the formula. Perfect for final practice or assessment.
What Is Percentage of Error?
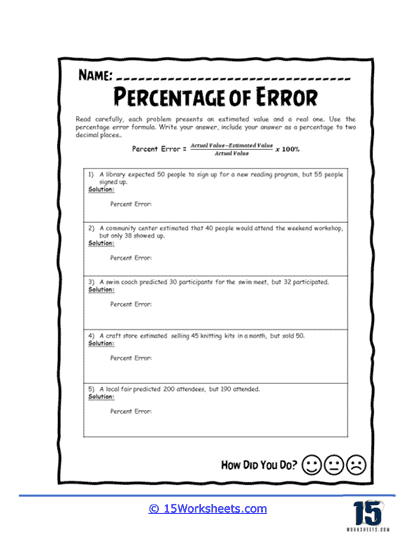
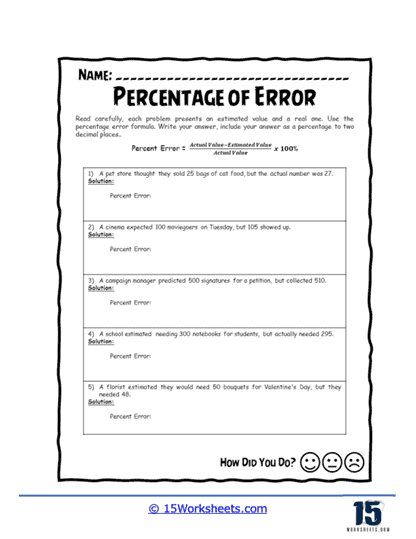
Percentage of error is a way to measure how close an estimate or prediction is to the actual value. The formula compares the difference between the two numbers and expresses it as a percentage. For example, if you estimated that 100 people would come to an event but 90 actually showed up, the error would be 10%. Turn that into a percentage of the actual value, and you’ve got your percentage of error.
This concept is everywhere in real life. Scientists use it in experiments to see how accurate their results are. Businesses use it to compare sales forecasts with real numbers. Even students use it, whether they realize it or not, when they check how close a guess was to reality. It’s a simple tool that makes accuracy measurable.
By working through these worksheets, students get comfortable applying the formula in many contexts. They practice not only doing the math but also interpreting what the results mean. That combination of skills helps learners become more precise thinkers. With enough practice, percentage of error becomes second nature-an everyday way to check and improve accuracy.
Percentage of Error In The Real World
Percentage of Error is a powerful tool used across a wide range of industries to measure the accuracy of predictions and estimates compared to actual outcomes. It quantifies how much an estimate deviates from reality, providing valuable insight that allows professionals to refine their processes, improve accuracy, and make better-informed decisions. Below are expanded examples of how percentage error is applied in different sectors, each demonstrating the critical role it plays in day-to-day operations.
In scientific research and experiments, percentage error is a key metric for understanding how closely experimental results match theoretical predictions. Scientists in fields like chemistry, physics, and biology use this calculation to determine whether their experiments yielded the expected outcomes or if there are significant discrepancies. For example, if a chemist expects a certain reaction to produce 10 grams of a substance but only measures 9 grams after conducting the experiment, the percentage error quantifies the difference between the predicted and actual result. This allows scientists to identify potential sources of error, such as inaccuracies in measurements, external environmental factors, or procedural mistakes. By consistently measuring and analyzing percentage error, researchers can refine their experimental techniques, improve the reliability of their results, and contribute more accurate findings to the scientific community.
In manufacturing and production, companies rely heavily on forecasts and estimates to ensure their processes run efficiently. Factories often set targets for how many units of a product should be produced in a given time frame, based on demand forecasts or production capacity. However, real-world production may fall short of or exceed these estimates due to equipment malfunctions, supply chain issues, or labor shortages. For instance, if a factory estimates that it will produce 1,000 units of a product but only 950 are manufactured by the end of the day, calculating the percentage error allows the company to measure the shortfall. This helps managers identify inefficiencies in the production process and make adjustments to improve productivity or ensure more accurate forecasts in the future. Understanding percentage error in this context helps manufacturers optimize their operations, reduce waste, and better meet customer demand.
In weather forecasting, percentage error is used by meteorologists to evaluate the accuracy of their predictions. Forecasts play a crucial role in helping individuals, businesses, and governments prepare for weather events, but the inherent unpredictability of the atmosphere means that forecasts are not always perfect. For example, if a weather forecast predicts 20 millimeters of rainfall, but only 15 millimeters are recorded, the percentage error measures how far off the prediction was. By calculating this error, meteorologists can analyze the factors that led to the discrepancy—such as unexpected changes in wind patterns, humidity levels, or pressure systems. This helps weather experts refine their models and make more accurate predictions in the future, ultimately improving public safety and reducing the potential for weather-related disruptions in industries such as agriculture, transportation, and construction.
In the realm of business and finance, percentage error is used to measure the accuracy of financial forecasts. Businesses rely on revenue and sales projections to make decisions about budgeting, staffing, and investment. However, external factors such as market conditions, consumer behavior, or supply chain disruptions can lead to actual results that differ from projections. For instance, if a company forecasts $1 million in sales but only generates $900,000, the percentage error provides a clear indication of the deviation from the expected outcome. This allows financial managers to assess the reasons behind the discrepancy and adjust future forecasts to reflect more realistic expectations. Understanding the percentage error in financial forecasting is essential for businesses seeking to manage risk, allocate resources effectively, and maintain profitability.
In construction and engineering, percentage error is used to compare estimated project costs and timelines with actual expenses and completion dates. Construction projects are often subject to delays, cost overruns, or changes in scope, which can lead to significant deviations from the original estimates. For example, a construction company may estimate that a building project will cost $500,000, but the final cost might end up being $550,000. By calculating the percentage error, project managers can determine how far off their initial estimates were and analyze the factors that contributed to the increased costs, such as unexpected material price increases or labor shortages. This analysis helps engineers and project managers improve their cost estimation techniques for future projects, ensuring that budgets are more accurate and timelines are better adhered to. Minimizing percentage error in construction is critical for maintaining client trust and staying within budget.
In retail and inventory management, percentage error is often used to assess the accuracy of sales forecasts and inventory levels. Retailers make projections about how many units of a product they expect to sell based on factors such as past sales data, market trends, and seasonal demand. However, actual sales figures can sometimes fall short of or exceed these expectations due to consumer behavior or economic conditions. For example, if a store estimates it will sell 500 units of a product but only 450 units are sold, the percentage error helps managers understand how much the actual sales deviated from the forecast. This information allows retailers to make better decisions about ordering, inventory management, and promotions to avoid overstocking or understocking items. By consistently monitoring percentage error, retailers can fine-tune their forecasting processes and optimize inventory turnover.