Simple Pictograph Lesson
Worksheet Description
This walks you through all of the steps of answering these types of questions. It can be helpful to position yourself through process.
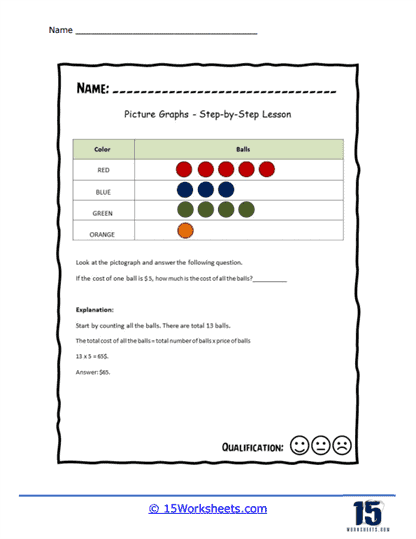
This worksheet is an educational tool for teaching students how to interpret data from a pictograph. It includes a pictograph that categorizes balls by color: red, blue, green, and orange. The students are given a question about the total cost of all the balls if one ball is worth $5. Below the pictograph, there is an explanation guiding students on how to approach the question, including counting the total number of balls and then multiplying by the cost per ball to find the total cost.
The worksheet is designed to teach students the basics of working with pictographs and applying arithmetic to find answers. It demonstrates how to gather quantitative information from a visual chart and translate it into a numerical calculation. The step-by-step explanation shows the importance of systematic problem-solving, starting with counting items represented by symbols and then performing multiplication to obtain a total value. This exercise helps students to connect visual data representation with mathematical operations, reinforcing their numeracy skills in the context of interpreting and analyzing data.