Favorite Shape Bar Graph
Worksheet Description
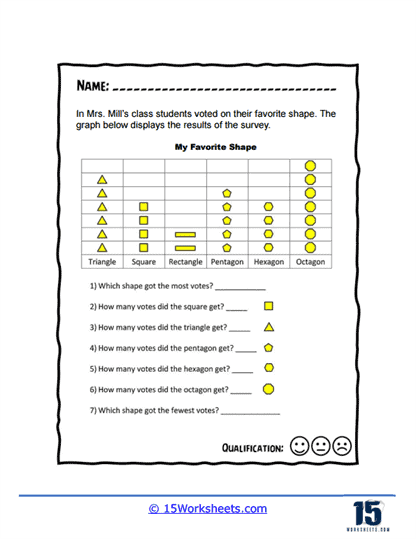
Students were surveyed for their favorite geometric shape. The results are displayed using a vertical boxed bar graph. You will answer a series of questions based on all this data.
The worksheet is a graphical representation of a survey conducted in Mrs. Mill’s class, where students voted for their favorite geometric shape. It features a pictograph titled “My Favorite Shape,” with symbols representing different geometric shapes-triangles, squares, rectangles, pentagons, hexagons, and octagons-along with corresponding marks indicating the number of votes each shape received. Students are tasked with interpreting the pictograph to answer questions about which shape received the most and fewest votes and to determine the exact number of votes for each shape. The worksheet is designed to be both engaging and educational, utilizing a topic that students can easily relate to.
This worksheet’s educational goal is to teach students how to interpret and analyze data presented in a pictograph. By quantifying visual symbols into numerical data, students learn to compare and contrast information and to make inferences based on the graphical representation. The questions guide them through a step-by-step analysis, reinforcing their skills in data interpretation, counting, and basic statistical analysis. It also encourages logical thinking as students must deduce quantities from a set of visual clues, an essential skill for understanding more advanced topics in data representation.