Venn Diagram Word Problems Worksheets
About These 15 Worksheets
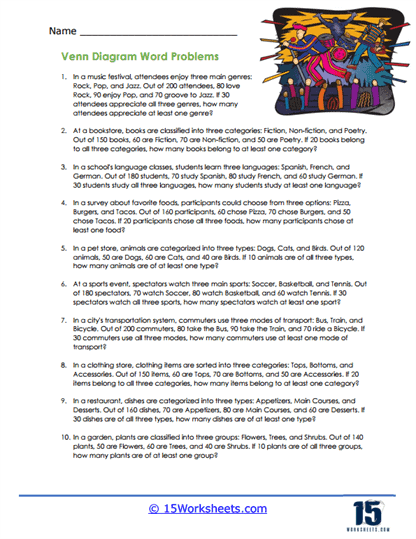
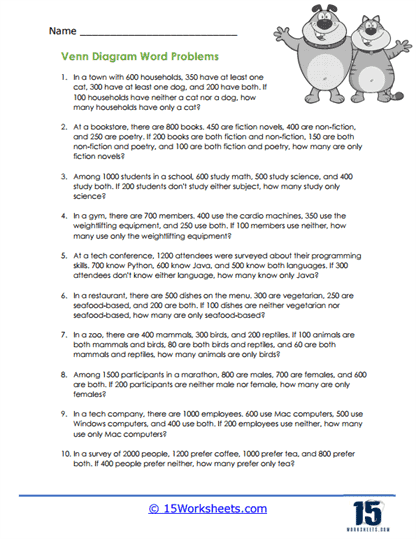
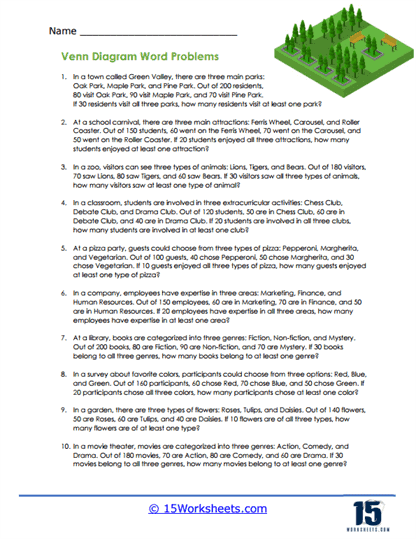
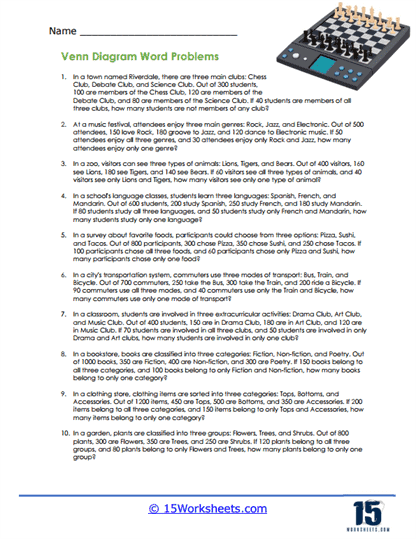
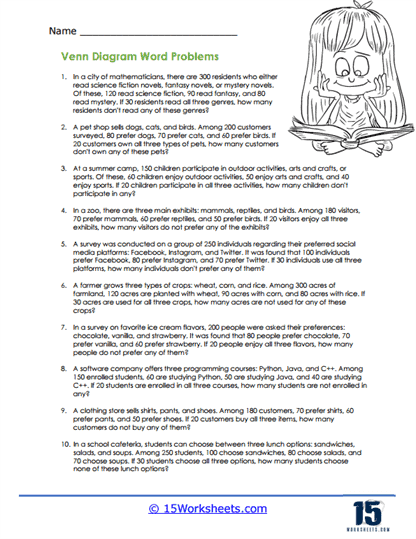
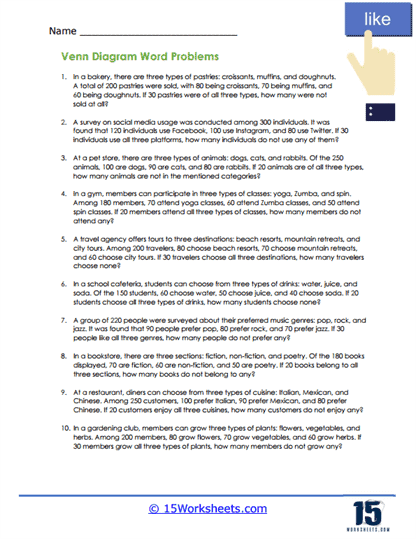
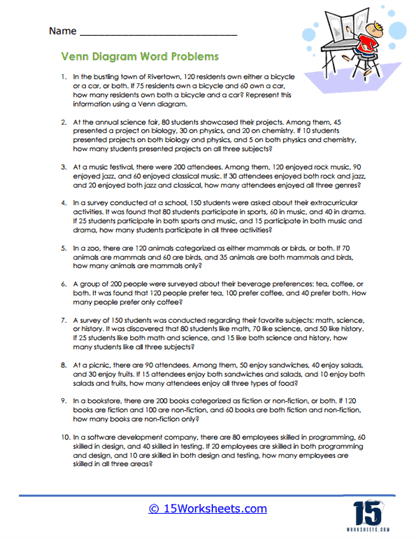
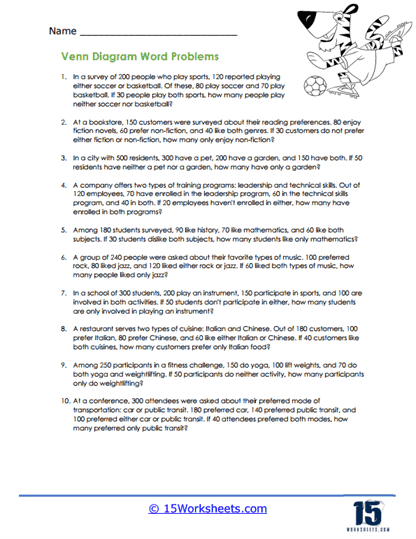
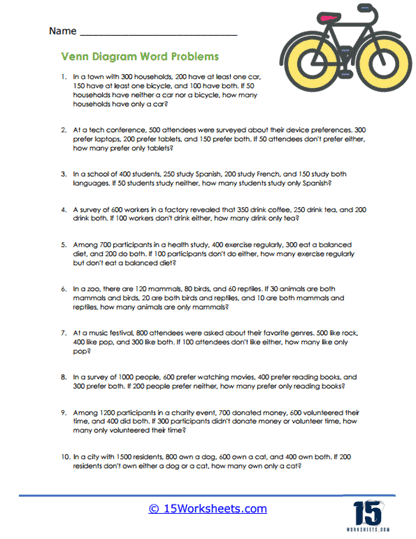
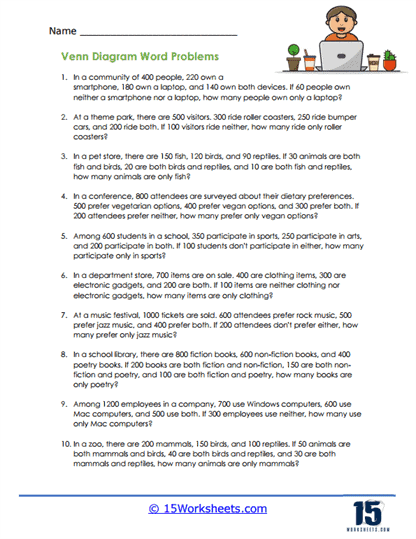
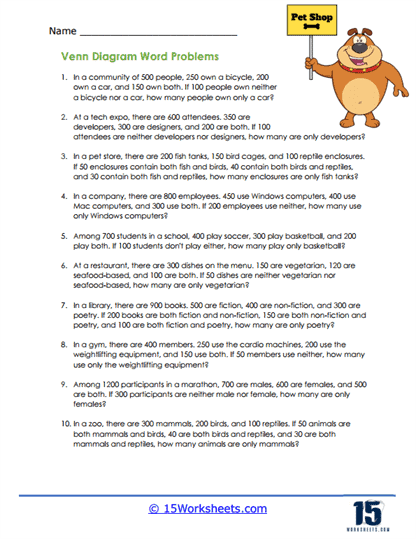
These word problem worksheets will help students understand and apply the principles of set theory and logic using Venn diagrams. These worksheets present problems that require students to visualize and solve problems involving the relationships between different sets. By working through these problems, students develop their ability to think critically and analytically, improving their understanding of mathematical concepts and their applications in the real world.
These worksheets include a variety of problems that involve identifying elements of sets, using set operations and notation, calculating the cardinality of sets, and solving probability problems. By practicing with these worksheets, students can improve their understanding of real-world math, develop critical thinking and problem-solving skills, and enhance their ability to visualize and represent data. As a result, Venn Diagram word problem worksheets play a crucial role in students’ mathematical education, helping them develop the skills and knowledge they need to succeed in their future studies and careers.
On these worksheets, you would expect to see a variety of problems that utilize two or more sets. These problems often involve identifying intersections, unions, and differences between sets, as well as understanding concepts such as subsets, complements, and the cardinality of sets. The worksheets may include diagrams with overlapping circles that represent different sets, along with accompanying questions that require students to analyze and interpret the information.
One common type of problem found on these worksheets involves identifying the elements that belong to different parts of the Venn diagram. For example, a problem might present two overlapping circles representing students who play soccer and students who play basketball. Students might be asked to determine how many students play both sports, only one of the sports, or neither sport. These problems help students understand the concept of intersections and unions of sets and how to visually represent and interpret these relationships using Venn diagrams.
Another type of problem involves using Venn diagrams to solve more complex word problems. For instance, a worksheet might describe a survey of people and their preferences for different types of food, such as pizza, burgers, and pasta. Students would need to use a three-circle Venn diagram to represent the data, determining how many people like each type of food, how many like combinations of the foods, and how many do not like any of the foods. This type of problem requires students to carefully analyze the given information, organize it into the diagram, and use logical reasoning to solve the problem.
This collection of worksheets also frequently include problems that involve set operations and notation. Students might be asked to write the union or intersection of sets in set notation, determine the complement of a set, or find the difference between two sets. For example, a problem might involve two sets representing students who have read two different books, and students would need to use set notation to describe the students who have read only one of the books or both books. These problems help students become familiar with the formal language of set theory and improve their ability to work with abstract mathematical concepts.
In addition to set operations, these worksheets often include problems that require students to calculate the cardinality of sets. Cardinality refers to the number of elements in a set. For example, a problem might present a Venn diagram with circles representing people who like different types of music and ask students to calculate the total number of people surveyed, the number of people who like only one type of music, or the number who like multiple types. These problems help students understand how to count and organize data and reinforce their skills in basic arithmetic and algebra.
Some Venn Diagram word problem worksheets might also include problems that involve probability. For example, students might be asked to use a Venn diagram to calculate the probability of a randomly selected person having a particular characteristic or combination of characteristics. A problem might describe a survey of people’s preferences for different types of activities and ask students to calculate the probability that a person chosen at random likes both hiking and swimming, only one of the activities, or neither activity. These problems help students understand how to use Venn diagrams to solve problems in probability and statistics and demonstrate the practical applications of these mathematical concepts.
These worksheets can significantly enhance students’ understanding of real-world math. These worksheets help students develop critical thinking and problem-solving skills by requiring them to analyze and interpret data, organize information, and use logical reasoning to solve problems. By working through a variety of problems, students learn how to apply mathematical concepts to practical situations, which is an essential skill in many fields, including science, engineering, business, and everyday life.
One of the key benefits of practicing with Venn Diagram word problem worksheets is that they help students develop a deeper understanding of set theory and logic. By working with sets and their relationships, students learn how to think abstractly and work with mathematical concepts that are foundational to many areas of mathematics. This understanding can help students in their future studies, as set theory is a fundamental part of many advanced mathematical topics, including algebra, calculus, and discrete mathematics.
These worksheets help students improve their ability to visualize and represent data. By working with Venn diagrams, students learn how to organize information in a way that makes it easier to understand and analyze. This skill is particularly important in fields such as data science and statistics, where visual representations of data are often used to communicate complex information effectively.
Practicing with problems also helps students develop their ability to work with probability and statistics. By solving problems that involve calculating probabilities and analyzing data, students learn how to use mathematical concepts to make informed decisions and predictions. This skill is valuable in many real-world situations, such as in finance, healthcare, and social sciences, where understanding and analyzing data is essential.
These worksheets encourage students to develop their problem-solving and analytical skills. By working through a variety of problems, students learn how to approach complex problems methodically, identify relevant information, and use logical reasoning to find solutions. These skills are essential for success in many areas of life, including academic studies, professional careers, and everyday decision-making.
Example Problem: Survey on Hobbies
A survey of 100 people asked whether they liked reading, gardening, or both. The survey results showed that 60 people liked reading, 45 people liked gardening, and 20 people liked both activities. How many people liked only reading, only gardening, and neither activity?
Solution
Step #1 – Identify the Sets
Let R represent the set of people who like reading.
Let G represent the set of people who like gardening.
Given:
∣R∣ = 60
∣G∣ = 45
∣R∩G∣ = 20 (people who like both reading and gardening)
Step #2 – Draw the Venn diagram
Draw two overlapping circles, one for R and one for G.
Label the intersection (overlapping area) with 20 (people who like both).
Step #3 – Calculate the number of people who like only reading.
∣R∖G∣=∣R∣ – ∣R∩G∣
∣R∖G∣ = 60 – 20 = 40
So, 40 people like only reading.
Step #4 – Calculate the number of people who like only gardening.
∣G∖R∣ = ∣G∣ – ∣R∩G∣
∣G∖R∣ = 45 – 20 = 25
So, 25 people like only gardening.
Step #5 – Calculate the number of people who like neither activity:
Total number of people surveyed = 100
Number of people who like reading, gardening, or both:
∣R∪G∣ = ∣R∣ + ∣G∣ – ∣R∩G∣
∣R∪G∣ = 60 + 45 – 20 = 85
Number of people who like neither:
100 – 85 = 15
Answer:
40 people like only reading.
25 people like only gardening.
15 people like neither activity.

