More Food Pictographs
Worksheet Description
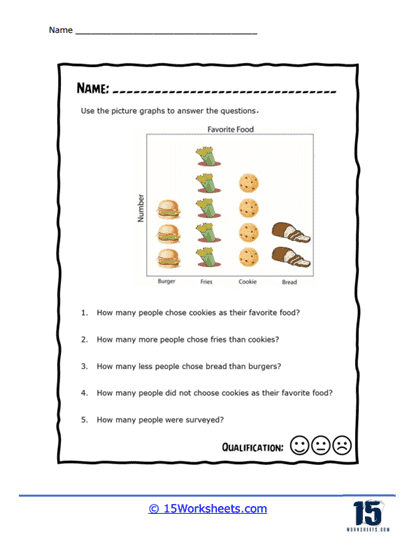
This is a pictograph that encapsulates the foods that students like in class. Use that graph to determine the answer to a series of problems.
This worksheet features a pictograph titled “Favorite Food,” which displays various food items such as burgers, fries, cookies, and bread. Each food item has a corresponding number of images next to it, indicating the number of people who prefer that food. Students are required to analyze the pictograph to answer questions about the data presented, such as how many people chose a certain food as their favorite, comparisons between the numbers of people who chose different foods, and the total number of people surveyed.
The worksheet is intended to teach students how to interpret pictorial data and extract information to make quantitative and comparative statements. It encourages the development of counting skills and understanding how to translate visual representations into numerical data. The students also learn to perform basic subtraction to find out how many people did not choose a specific food item. By working through the questions, students enhance their ability to comprehend and analyze information presented in the form of a pictograph, a key skill in data interpretation within mathematics and other areas of study.