Beachballs and Pears Diagram
Worksheet Description
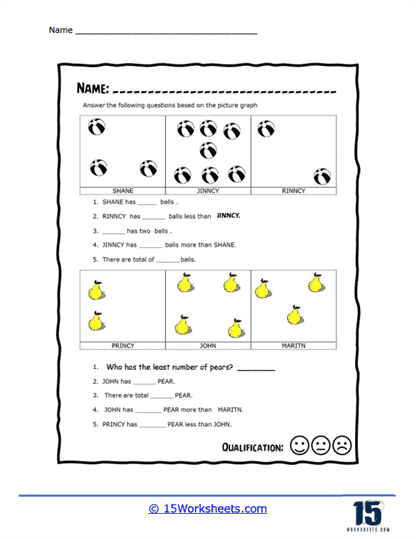
These little pictographs display the number of beachballs and pears that a group of teenagers has. You will use this information to answer a series of questions.
This worksheet is a comprehension exercise based on two pictographs, each representing a different set of items: balls and pears. For each pictograph, students are given a series of questions requiring them to analyze the graph and fill in the blanks with the correct numerical values or names. The first pictograph shows three individuals, Shane, Rinncy, and Jinncy, with varying numbers of balls, while the second pictograph shows the number of pears associated with three different individuals, Princy, John, and Martin. Students must deduce quantities and comparisons from the pictographs to complete the statements.
The worksheet is designed to teach students how to extract information from pictographs and use it to make comparisons and perform simple calculations. It encourages students to practice counting and to compare quantities visually represented by symbols. The questions guide them to think critically about the information presented and make specific numerical or relational statements based on that data. This activity not only reinforces quantitative reasoning but also introduces basic data interpretation skills, which are essential for mathematics and everyday problem-solving.