Cow and Car Picture Graphs
Worksheet Description
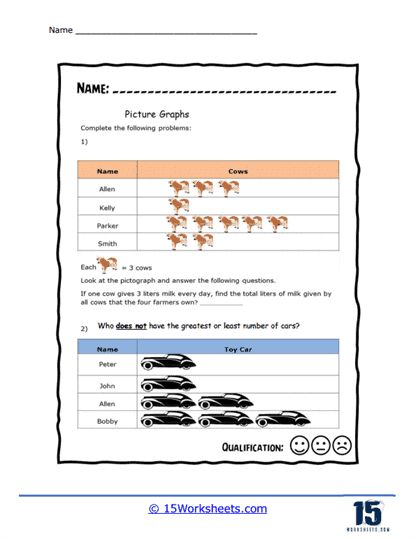
Use the pictographs of the population of cows and cars to help you answer this series of questions.
This worksheet contains two sections of pictograph problems for students to solve. The first section has a pictograph that shows the number of cows owned by four different farmers, and each image of a cow represents three cows. A related question asks students to calculate the total liters of milk produced if each cow gives three liters every day. The second section displays a pictograph representing the number of toy cars owned by four different children, and students are asked to determine which child does not have the greatest or least number of cars.
The worksheet teaches students how to interpret pictographs, a type of graph where symbols represent a certain number of items. By using the provided key, students learn to multiply to find out the total number of cows and the total milk production. It also helps them develop comparative skills to determine rankings based on the number of items represented in the second pictograph. The activity not only reinforces mathematical concepts such as multiplication and comparison but also enhances problem-solving and analytical thinking skills.