Seashell Chart
Worksheet Description
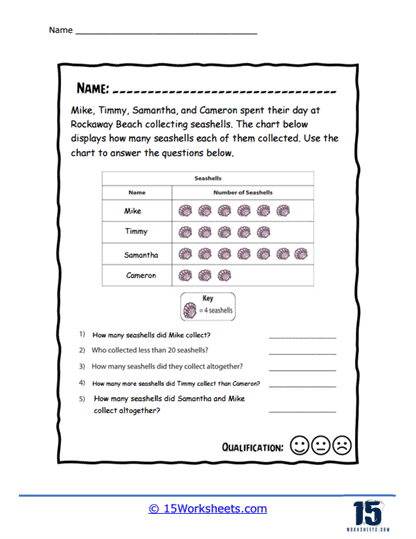
Mike, Timmy, Samantha, and Cameron spent their day at Rockaway Beach collecting seashells. The chart below displays how many seashells each of them collected. Use the chart to answer the questions found on the bottom of the worksheet.
This worksheet is a math activity that revolves around interpreting data from a pictograph. Mike, Timmy, Samantha, and Cameron have collected seashells at Rockaway Beach, and the chart illustrates the number of seashells each person has collected. The chart uses a key where one image of a seashell represents four actual seashells. Students are required to use the information from the pictograph to answer a set of questions regarding the seashell collection of each individual and their combined totals.
The worksheet is designed to teach students how to read and analyze data presented in a pictograph format. It helps them practice basic multiplication and addition by using the key to determine the actual number of seashells collected. The questions aim to develop comparative analysis skills by having students determine who collected more or less than a certain amount. Additionally, this activity encourages the students to apply their understanding of pictographs to solve problems, which is a foundational skill in data interpretation and mathematics.