Create a Ball Pictograph
Worksheet Description
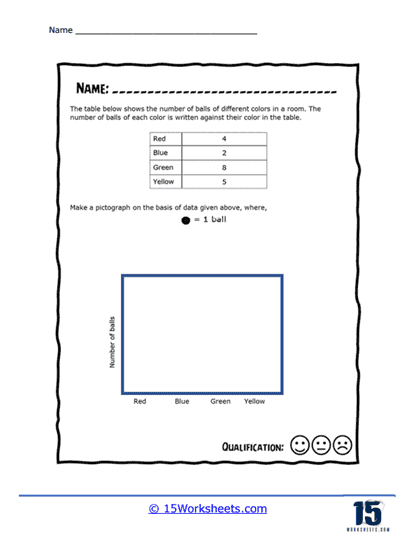
The table shows the number of balls in a room. The data is sorted by the color of the ball. You will take this data and create a picture graph to display this data.
This worksheet features a table that lists the number of balls of different colors (red, blue, green, and yellow) found in a room. Below the table, there is a blank area designated for creating a pictograph, and a key is provided indicating that one image will represent one ball. Students are tasked with converting the numerical data from the table into a visual pictograph by drawing symbols that correspond to the number of balls of each color. This requires students to translate the quantitative data into a pictorial form.
The worksheet is intended to teach students how to create a pictograph from a given set of data. It helps them to understand the relationship between numerical values and visual symbols in data representation. By drawing the pictograph themselves, students reinforce their understanding of one-to-one correspondence and practice translating numerical information into visual formats. This exercise is particularly useful for developing skills in data visualization, an important aspect of interpreting and presenting information in both mathematics and real-world situations.