Fruits Pictograph
Worksheet Description
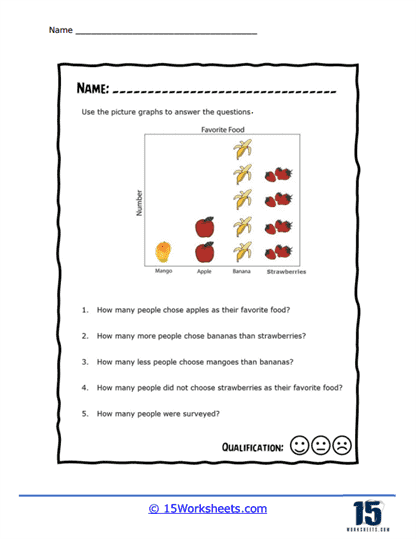
This picture graph displays student the fruit preferences of students in a school. Use this data to answer the problems.
This worksheet provides a pictograph titled “Favorite Food,” displaying four different fruits-mango, apple, banana, and strawberries-and the number of people who prefer each as their favorite food, represented by images of the respective fruit. Students are asked to interpret the pictograph to answer questions regarding the number of people who chose each fruit, the comparative popularity of the fruits, and the overall number of people who participated in the survey. They must analyze the pictograph to calculate and compare the quantities represented by the images.
The worksheet teaches students to read and understand pictographs, a visual tool for representing numerical data with images. It develops their counting skills and ability to compare quantities, reinforcing the concept that each image represents a certain number of items. The questions encourage critical thinking, as students must determine not only the direct quantities but also perform basic subtraction to figure out how many people did not choose a particular fruit. This type of exercise is essential for building foundational skills in data interpretation, a key aspect of mathematical literacy.