Breakfast and Dessert
Worksheet Description
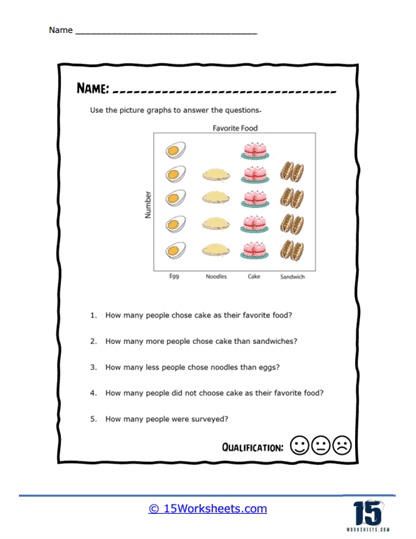
We asked students about their favorite thing to eat all day. You will answer a series of questions based on the pictograph of all the data.
This worksheet presents a pictograph that illustrates different food items-eggs, noodles, cake, and sandwiches-each represented by a corresponding number of images to indicate how many people prefer each food. Students are tasked with analyzing the pictograph to answer questions about how many people chose a particular food as their favorite, the difference in preferences between foods, and the total number of people surveyed. They must use the visual data provided to determine the popularity of each food item and perform simple calculations to find out how many people did not choose a particular food as their favorite.
The worksheet is designed to teach students how to interpret data from pictographs, which are a visual representation of data. It encourages students to practice counting and basic subtraction skills. The worksheet also helps students develop their ability to compare quantities and to draw conclusions from graphical information. By completing this activity, students enhance their understanding of how to translate visual symbols into numerical data and use this information to make comparisons and answer questions related to the data set.