More Food Questions
Worksheet Description
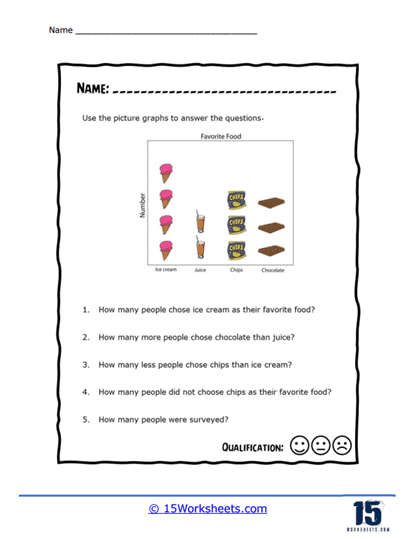
You are given a food pictograph. You will then fill in all the questions based on the food graph.
This worksheet showcases a pictograph that depicts people’s favorite foods, including ice cream, juice, chips, and chocolate. Each food item has a series of corresponding images that represent the number of people who favor that particular food. Students are tasked with analyzing the pictograph to answer a series of questions about the preferences shown, such as determining how many people selected a specific food as their favorite, comparing the popularity of different foods, and deducing the total number of people who were surveyed based on the pictorial data.
The worksheet aims to teach students how to interpret and analyze information presented in a pictograph. It helps them develop skills in counting and comparing quantities, as well as in making deductions from visual data. The questions are designed to guide students through various levels of data interpretation, from simple counting to more complex comparative analysis. This activity is also beneficial for enhancing students’ understanding of how pictographs represent numerical information and for applying this understanding to answer questions about the data.