Plotting Values
Worksheet Description
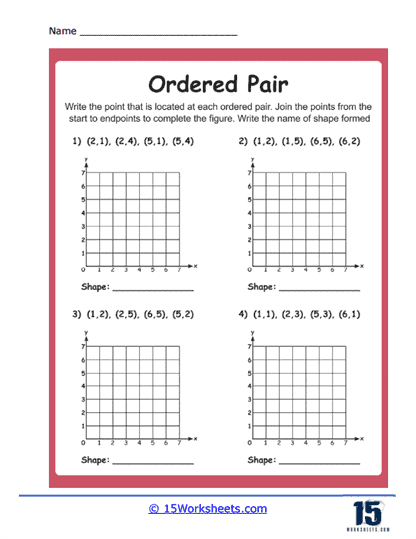
This worksheet is a mathematical exercise involving ordered pairs and the Cartesian coordinate system. It provides four separate sets of ordered pairs for students to plot on four individual grids. After plotting the points, students are instructed to connect them in the given sequence to form a geometric shape. Below each grid, there is space for students to write the name of the shape they have created by joining the points.
The worksheet is designed to teach students how to plot points on a coordinate grid and recognize geometric shapes formed by these points. It reinforces the concept of ordered pairs, where the first number represents the x-coordinate (horizontal position) and the second number represents the y-coordinate (vertical position). By connecting the dots, students can visualize how individual points create a larger figure, enhancing their understanding of shapes and graphing. Additionally, the task of identifying the shape aims to integrate geometry with coordinate graphing, encouraging students to see the connection between numerical coordinates and geometric figures.