Different Cake Plot
Worksheet Description
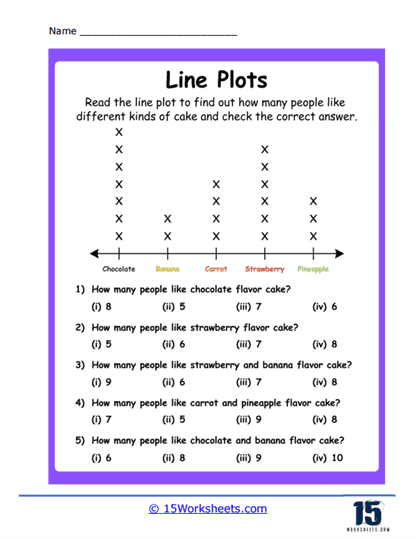
This worksheet features a line plot activity designed to understand preferences for different cake flavors among a group of people. The flavors listed are chocolate, banana, carrot, strawberry, and pineapple, with a corresponding number of ‘X’ marks above each to represent the number of people who prefer each flavor. Students must read the line plot and determine the quantity of individuals who favor each type of cake, with multiple-choice answers provided below each question. The questions further explore combined preferences, asking students to identify the number of people who like certain combinations of flavors.
The worksheet teaches students how to read and interpret data from a line plot. It helps them to practice counting and understand frequency within a dataset. By analyzing the plot to answer the questions, students develop skills in comparing and summarizing data. The inclusion of combination flavor questions enhances their ability to analyze more complex data relationships, such as intersections within datasets, fostering critical thinking and data literacy.