Furniture Sold Plot
Worksheet Description
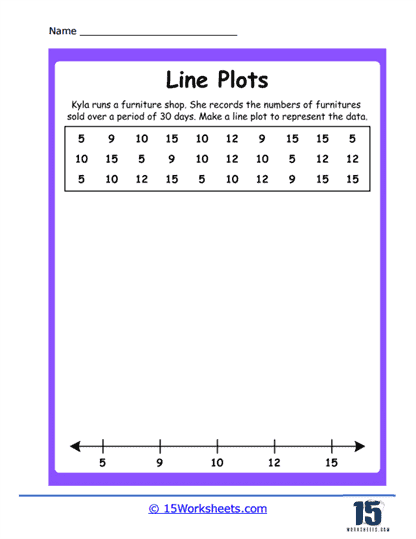
This worksheet is about creating a line plot based on the sales data of a furniture shop over a 30-day period. Kyla, the shop owner, has recorded the number of furniture pieces sold each day, with the data provided in a list format. Students are instructed to count the frequency of each sales figure and represent this data on a line plot using the number line at the bottom of the page. The numbers on the line plot range from 5 to 15, corresponding to the sales figures listed above.
The purpose of this worksheet is to teach students how to organize and display numerical data using a line plot. It allows students to practice counting and grouping numbers, which are essential skills for data analysis. By transferring the listed data to a line plot, students learn how to identify patterns and frequency of data points. This activity also encourages the development of students’ abilities in summarizing data, providing a visual interpretation of numerical information, and enhancing their understanding of the practical use of line plots in everyday contexts.