Making Line Plots
Worksheet Description
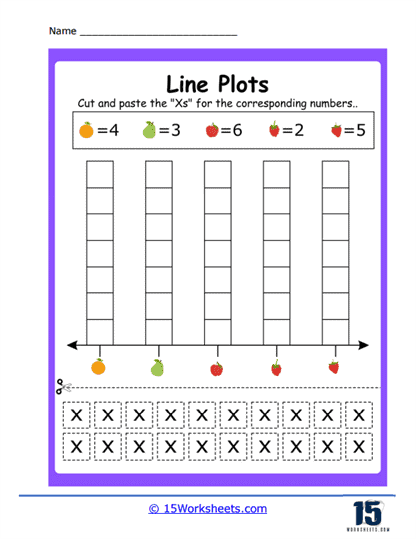
This worksheet is a line plot activity that involves matching and pasting. Students are given a series of colored fruits with corresponding numbers and a line plot with fruit symbols at the bottom. The task is to cut out the ‘X’ marks provided in a dotted box and paste them onto the line plot above the matching fruit symbol to represent the quantity specified by the number associated with each fruit. This interactive task combines the actions of cutting, pasting, and counting to create a visual representation of numerical data.
The worksheet is designed to teach students how to associate numbers with quantities and to represent this data visually on a line plot. By assigning a specific number of ‘X’ marks to each fruit, students practice counting and applying their counting to a task that requires precision and attention to detail. The cutting and pasting element of the activity also helps to refine fine motor skills. Furthermore, this exercise introduces students to the basics of creating graphs, an important skill for representing and interpreting data in mathematics.