Math Exam Plot
Worksheet Description
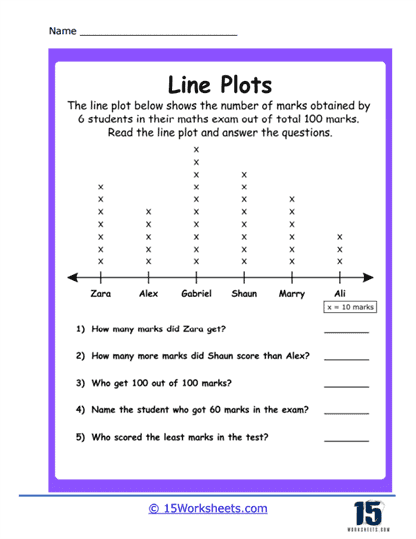
This worksheet presents a line plot that displays the scores of six students in a math exam, with each student’s name labeled below the plot. Each ‘X’ mark on the line plot represents a certain number of marks as indicated by the key, and students are expected to use this information to determine the exam scores. The worksheet includes questions that require the student to interpret the plot to find specific information such as individual scores, score comparisons between students, identifying the highest and lowest scores, and determining who achieved a particular score.
The worksheet is crafted to teach students how to read and interpret data from a line plot. It reinforces counting by multiples based on the key provided and requires the application of this count to answer questions about the data. The students practice extracting specific information from a graph, such as comparing scores and identifying ranges. This exercise also cultivates critical thinking by asking students to analyze the data to determine who scored the most, least, or a certain number of marks, thereby enhancing their data literacy and numerical reasoning skills.