Sports Line Plot
Worksheet Description
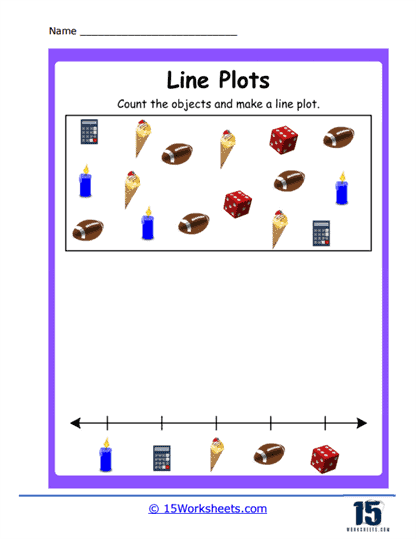
This worksheet is designed to introduce students to the concept of line plots, a type of graph that displays frequency of data along a number line. The task at hand involves counting various objects-presumably ice creams, calculators, and dice-displayed at the top of the page. Students are then instructed to represent the count of each object type on the line plot below, which has spaces corresponding to each type of object. This activity combines counting skills with the basics of graphical representation.
The worksheet teaches students how to create a line plot by counting items and plotting the frequency of each item on a number line. It helps students recognize and categorize different objects, reinforcing counting and basic data organization skills. By translating the count of objects into a visual representation, students gain a foundational understanding of how to interpret and construct graphs. Additionally, this exercise promotes analytical thinking as students begin to visualize and compare quantities in a graph format.