6 Weeks of Candy
Worksheet Description
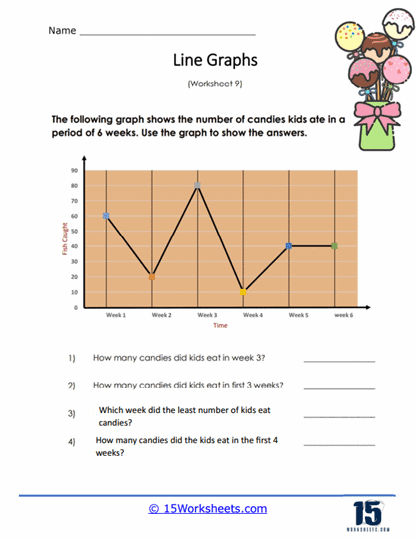
This worksheet provides you with a line graph that indicates the number of candies that kids ate each week. Use this graph to help you answer a series of questions.
This worksheet features a line graph that tracks the number of candies consumed by kids over a six-week period. The graph’s horizontal axis is labeled with the weeks, and the vertical axis shows the quantity of candies eaten. Students must use the graph to answer questions regarding specific data points, such as how many candies were eaten in a particular week, the total number of candies consumed over several weeks, identifying weeks with the highest and lowest candy consumption, and making calculations based on the data presented.
The worksheet is designed to teach students how to interpret and analyze information presented in a line graph. It focuses on extracting specific data points, identifying trends, and performing simple arithmetic operations based on the information provided by the graph. This exercise helps students develop their skills in reading and understanding graphical data, which is essential for various subjects, including math, science, and economics. By completing the worksheet, students enhance their ability to interpret trends and patterns, as well as their capacity to use graphs for practical problem-solving.