Catching Fish Graph
Worksheet Description
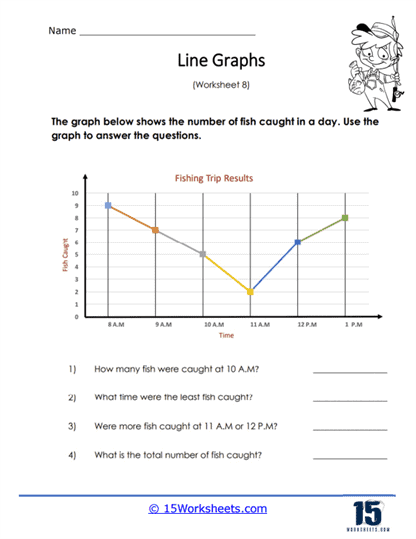
The graph that is provided displays the number of fish caught over the period of the day. It indicates the number of fish fisherman caught at set time periods. Use the line graph to help you answer all of the questions that proceed the line graph.
This worksheet includes a line graph that depicts the number of fish caught at different times over the course of a day. The times are marked on the horizontal axis, ranging from 8 A.M. to 1 P.M., and the vertical axis indicates the number of fish caught. Students are expected to read the graph and answer questions related to specific data points, such as determining the number of fish caught at 10 A.M., identifying the time when the least fish were caught, comparing the number of fish caught at different times, and calculating the total number of fish caught throughout the day.
The worksheet is intended to teach students how to interpret data from a line graph. It helps them to understand how to read specific values from a graph, observe trends in data over time, and perform basic numerical comparisons and calculations. This activity develops skills in data interpretation, which are crucial for understanding real-world scenarios that involve tracking changes over time. Completing the worksheet allows students to practice and enhance their analytical skills in a practical and engaging context.