Cake Sales Data
Worksheet Description
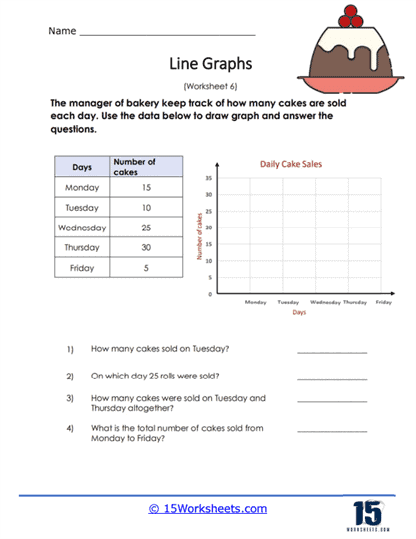
The manager of a bakery keeps tracks of all the cakes that were sold over a week at Apple Bakery. Use the data in the chart to create a line graph and then answer the questions based on this data.
This worksheet is designed around a bakery’s weekly sales data, specifically tracking the number of cakes sold each day from Monday to Friday. A table lists the weekdays alongside the corresponding number of cakes sold, which students are to use to construct a line graph on the accompanying axis. The line graph’s horizontal axis is labeled with the days of the week, and the vertical axis is marked for the number of cakes sold. After drawing the graph, students are expected to answer questions that test their ability to interpret the information represented in the graph.
The purpose of this worksheet is to teach students how to create and read a line graph based on given data. It helps them practice plotting points accurately on a graph according to the data provided and then connecting these points to illustrate trends in cake sales throughout the week. The questions at the end of the worksheet encourage students to engage with the graph, requiring them to analyze the data for specific details and to perform basic addition to calculate total sales. Through this activity, students learn to visualize numerical data and enhance their data interpretation skills.