Daniel’s Stamps
Worksheet Description
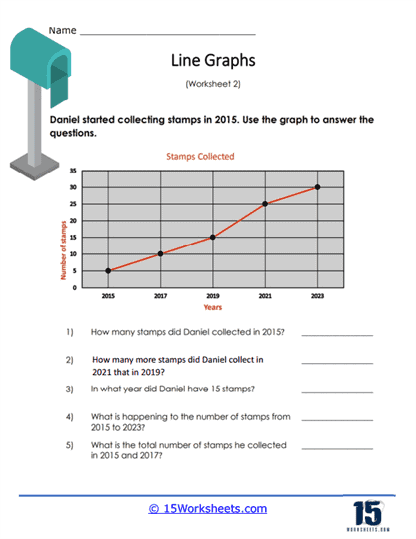
This line graph displays the number of stamps that Daniel has collected over the years. He began collecting stamps in 2015. Answer all the questions based on the graph.
This worksheet is centered around a line graph that depicts Daniel’s stamp collection growth from 2015 to 2023. The graph shows a clear upward trend, indicating an increase in the number of stamps collected over the years. Students are asked to use the graph to answer a set of questions about the collection, such as the number of stamps collected in certain years, the year in which Daniel reached a particular number of stamps, and calculations based on the data, like the total number of stamps collected during specific years.
The worksheet is designed to teach students how to read and interpret data from a line graph. It aims to help students practice extracting specific information, such as identifying values for particular years and understanding trends over time. The worksheet also encourages students to perform simple calculations using the graphed data, such as adding the number of stamps collected over consecutive years. By answering the questions, students will enhance their skills in data analysis and understanding graphical representations of data sets.