Maria the Giraffe
Worksheet Description
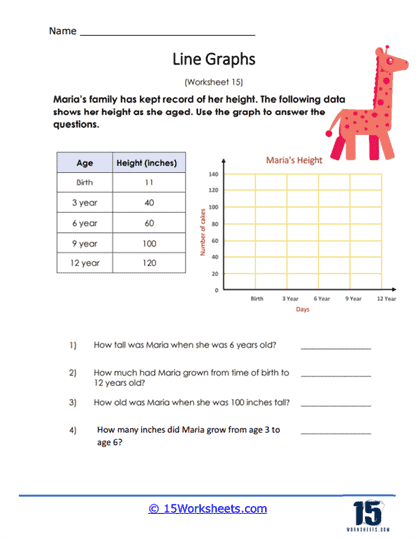
Maria’s family kept a journal noting her height each year. The data in the table displays this. Use this data to create a line graph and then read the line graph to answer critical thinking questions.
This worksheet is designed around a line graph that tracks the growth in height of a girl named Maria from birth to 12 years old. The table provided outlines specific ages-birth, 3 years, 6 years, 9 years, and 12 years-and the corresponding heights in inches. The accompanying graph is blank, implying that the student’s task is to plot these data points on the graph. After plotting, students must use the graph to answer questions about Maria’s height at certain ages, her growth over time, and her age when reaching specific heights.
The worksheet’s educational objective is to teach students how to plot data on a line graph and interpret the information represented by that graph. By entering the data from the table onto the graph, students learn how to visualize numerical data spatially. Answering the questions requires students to read and extract information from the graph, such as determining the exact or approximate height at a given age. This exercise enhances their ability to analyze and understand the practical significance of data trends over time, such as growth patterns in a child.