Interpreting Double Line Graphs
Worksheet Description
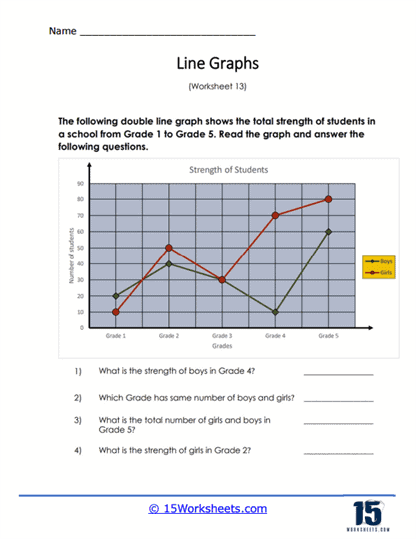
This worksheet displays a double line graph that displays the student population by grade level in a particular. One line stands for the boys and the other for girls. Use this double graph to answer all the questions that follow.
This worksheet features a double line graph that compares the population strength of boys and girls across grades 1 to 5 in a school. The graph plots two lines, each representing one gender, across the vertical axis showing the number of students and the horizontal axis indicating the grade levels. Students are tasked with interpreting the graph to answer questions about specific data points, such as the strength of boys in Grade 4, the grade where the number of boys and girls is equal, the total number of girls and boys in Grade 5, and the strength of girls in Grade 2.
The worksheet is designed to teach students how to read and analyze double line graphs, which depict two sets of related data. It encourages them to extract specific information from the graph, such as comparing figures for different categories at a single grade level or across multiple grade levels. The task also improves the students’ ability to perform simple arithmetic operations by calculating totals or comparing quantities. By answering the questions, students learn to apply their understanding of graphs to practical examples, enhancing their data interpretation skills.